. 2014 Jul 17;9(7):e101670.
doi: 10.1371/journal.pone.0101670. eCollection 2014.

NCI-60 whole exome sequencing and pharmacological CellMiner analyses

Affiliations

NCI-60 whole exome sequencing and pharmacological CellMiner analyses

William C Reinhold et al. PLoS One. .

Abstract

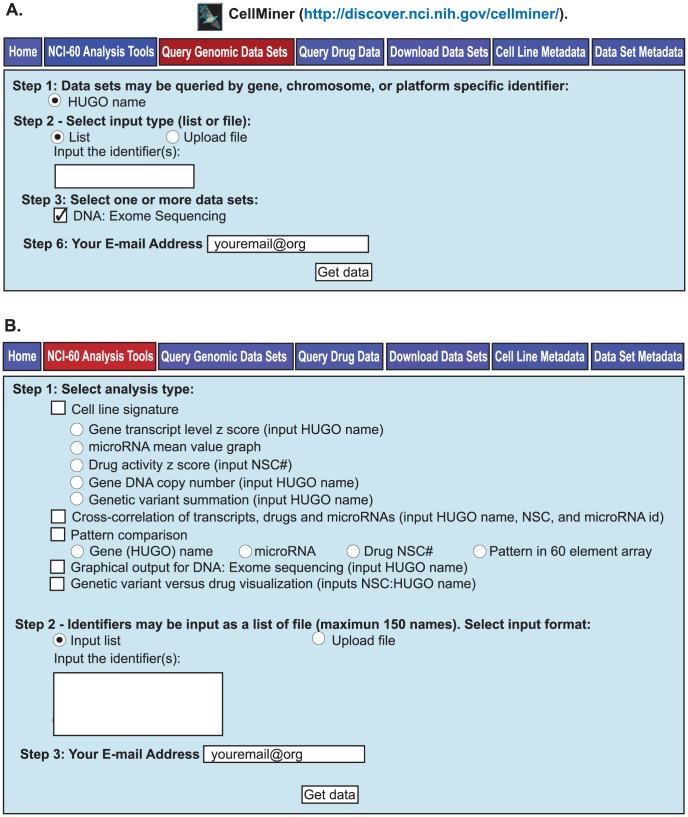
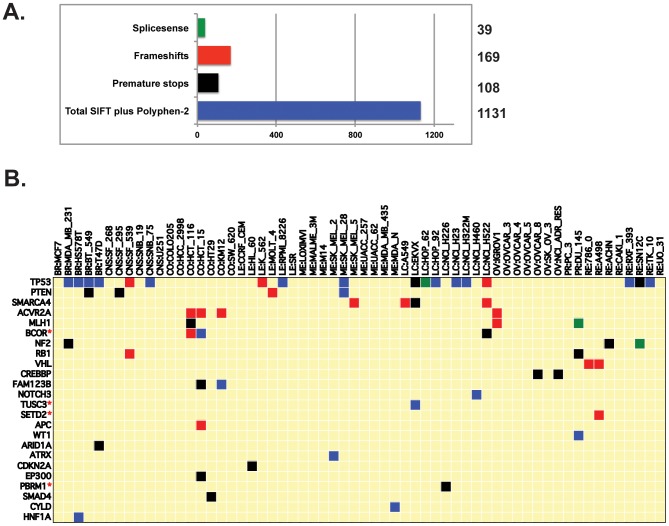
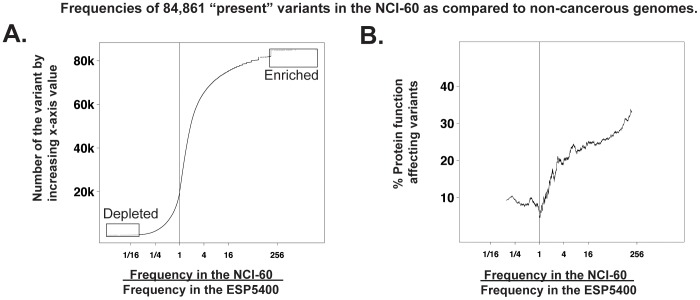
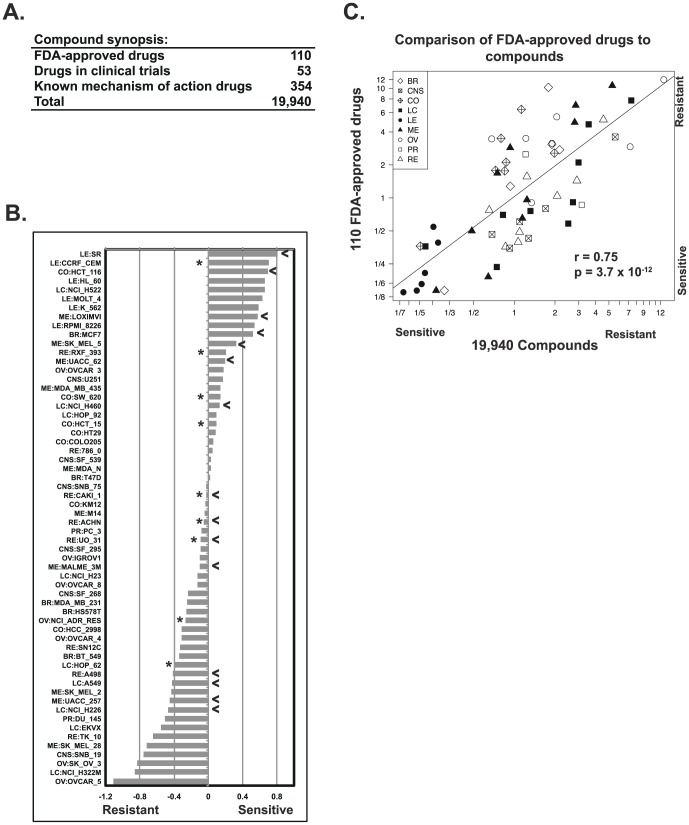
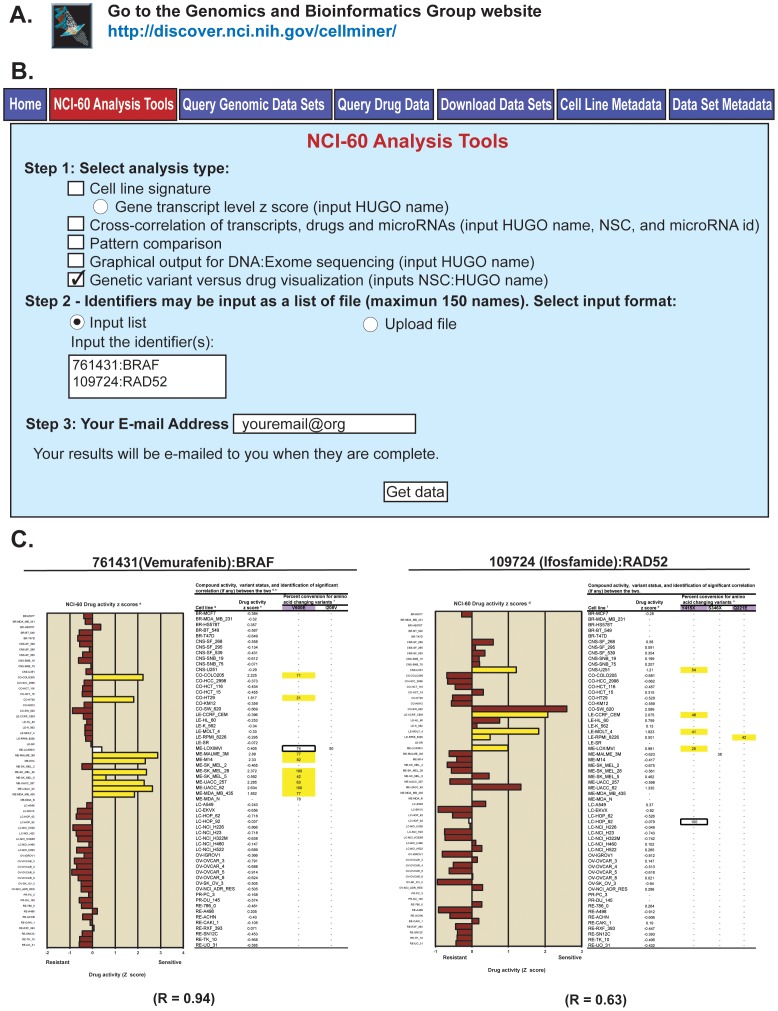
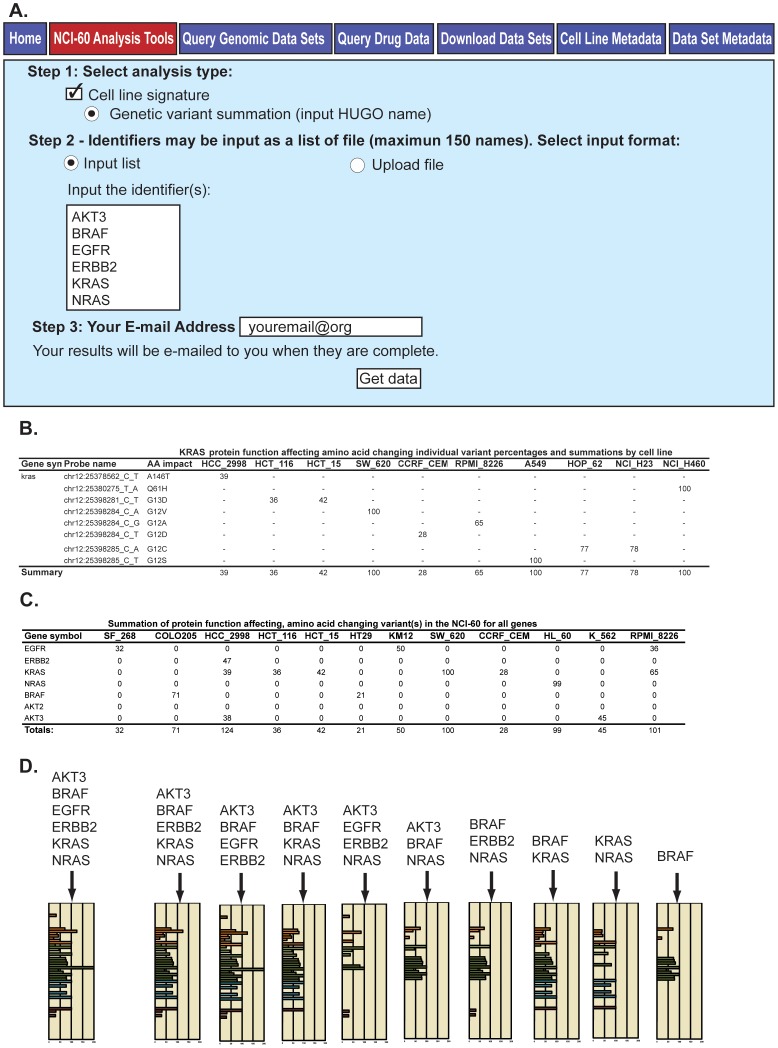
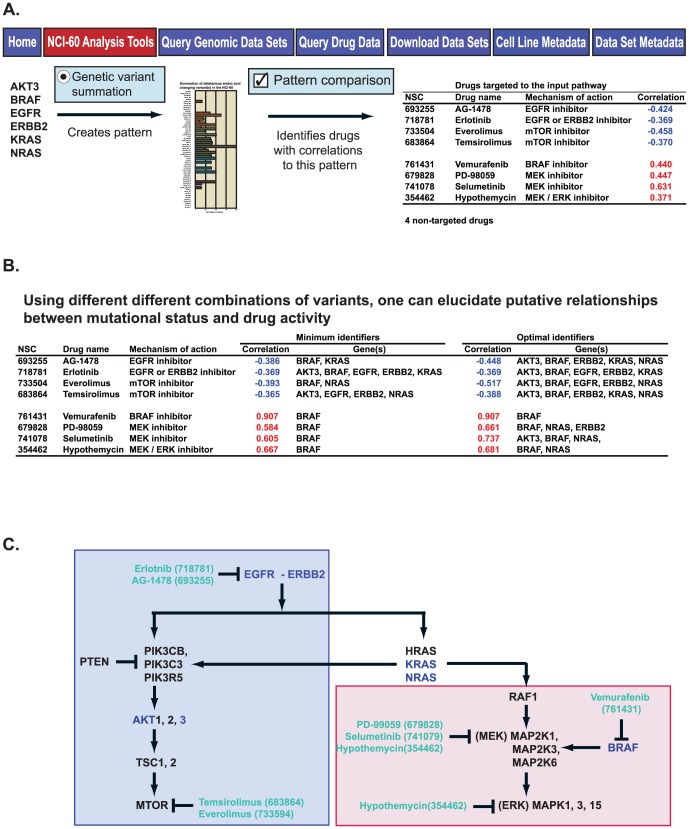
Exome sequencing provides unprecedented insights into cancer biology and pharmacological response. Here we assess these two parameters for the NCI-60, which is among the richest genomic and pharmacological publicly available cancer cell line databases. Homozygous genetic variants that putatively affect protein function were identified in 1,199 genes (approximately 6% of all genes). Variants that are either enriched or depleted compared to non-cancerous genomes, and thus may be influential in cancer progression and differential drug response were identified for 2,546 genes. Potential gene knockouts are made available. Assessment of cell line response to 19,940 compounds, including 110 FDA-approved drugs, reveals ≈80-fold range in resistance versus sensitivity response across cell lines. 103,422 gene variants were significantly correlated with at least one compound (at p<0.0002). These include genes of known pharmacological importance such as IGF1R, BRAF, RAD52, MTOR, STAT2 and TSC2 as well as a large number of candidate genes such as NOM1, TLL2, and XDH. We introduce two new web-based CellMiner applications that enable exploration of variant-to-compound relationships for a broad range of researchers, especially those without bioinformatics support. The first tool, "Genetic variant versus drug visualization", provides a visualization of significant correlations between drug activity-gene variant combinations. Examples are given for the known vemurafenib-BRAF, and novel ifosfamide-RAD52 pairings. The second, "Genetic variant summation" allows an assessment of cumulative genetic variations for up to 150 combined genes together; and is designed to identify the variant burden for molecular pathways or functional grouping of genes. An example of its use is provided for the EGFR-ERBB2 pathway gene variant data and the identification of correlated EGFR, ERBB2, MTOR, BRAF, MEK and ERK inhibitors. The new tools are implemented as an updated web-based CellMiner version, for which the present publication serves as a compendium.


Conflict of interest statement

Competing Interests: Regarding potential competing interests and financial disclosure, Sudhir Varma is a contractor for the Developmental Therapeutic Branch, and the owner of HiThru Analytics LLC. Margot Sunshine is a contractor for the Developmental Therapeutic Branch, and an employee of the SRA International. WCR, ODA, SRD, KWK, JM, PSM, JHD, and YP are members of the US Government. This does not alter the authors' adherence to PLOS ONE policies on sharing data and materials.

Figures

Figure 1
Figure 1. The two tabs for retrieving WES data in CellMiner.
A. The Query Genomic Data Sets tab. All exome data for a gene may be accessed at http://discover.nci.nih.gov/cellminer/ under the “Query Genomic Data Sets” tab. HUGO name may be selected in Step 1, and List in Step2. The gene identifiers (up to 150 per query) are entered as HUGO names, also in Step 2. The data set, DNA:Exome Sequencing is entered in Step 3. Enter your email address in Step 6, and click “Get data” to receive the output (as an Excel file). B. The NCI-60 Analysis Tools tab. Five forms of synopsis data are available for selection in Step 1; Cell line signatures , Cross-correlation , Pattern comparison , Graphical output for DNA:Exome sequencing , and Genetic variant versus drug visualization (Figure 5). Identifiers are entered in Step 2. Enter your email address in Step 3, and click “Get data”.
Figure 2
Figure 2. Homozygous, amino-acid changing, putative protein-function-affecting genetic variants present in the NCI-60, and absent in the 1000 Genomes and ESP5400.
A. The four categories of protein-function-affecting variants, and their level of occurrence. The x-axis is the number of variants in each category, with exact numbers given to the right. B. Potential knockout cell lines for tumor suppressors. The x-axis indicates the cell lines. The y-axis indicates the tumor suppressors. Green, red, black, and blue square indicate the presence of homozygous splicesense, frameshift, premature stop, and SIFT or PolyPhen-2 knockouts, respectively (as in A). Additional potential knockouts for the whole genome across the NCI-60 can be readily found in Table S1.
Figure 3
Figure 3. Comparisons of variant frequencies in the NCI-60 to that in non-cancerous tissues (the ESP5400).
A. Scatter plot for all 84,861 variants that occur both in the NCI-60 and the ESP5400. The x-axis is the ratio of frequencies of variants in the NCI-60 vs. the frequencies of the same variants in the ESP5400. The y-axis is the number of the variants, ordered by the frequency ratio. The boxed “Enriched” variants (in the NCI-60) include 2,792 variants, and the boxed “Depleted” variants numbers 319. Enrichment is defined as the top 2.5% of variants for which the ratio of frequencies is ≥10. Depletion is defined as the bottom 2.5% of variants, for which the ratio of frequencies is ≤0.1. In both A and B, the vertical lines drawn at x = 1 indicate equal frequencies in the NCI-60 and non-cancerous genomes (ESP5400). B. Scatter plot for the protein-function-affecting variants that occur in both the NCI-60 and the non-cancerous genomes. The y-axis is the percent of protein function affecting amino-acid changing variants (as compared to all variants) within a sliding window of size 2001.
Figure 4
Figure 4. Overall drug responses in the NCI-60.
A. Compounds and drugs used in the present analyses. B. The cellular responses to the 19,940 compounds were categorized for each cell line, as resistant (z score ≤−0.5), no response (z score >−0.5 to <0.5), or sensitive (z score ≥0.5). The number of compounds categorized as leading to sensitivity or resistance was determined for each cell line. The ratio of these resistance:sensitivity determinations (plotted as −log10 values) is on the x-axis. The cell lines are on the y-axis. Asterisks denote ABCB1-positive cells as measured by rhodamine efflux . Arrowheads denote cell lines that are TP53 wild-type. C. Scatter plot of resistance:sensitivity ratios for the 19,940 compounds (x-axis) versus the 110 FDA-approved drugs (y-axis). The same ratios of resistance:sensitivity from B were determined for the subset of 110 FDA-approved drugs. Each point is a cell line (plotted as -log values). Tissues of origin are indicated: BR is breast, CNS is central nervous system, CO is colon, LC is lung cancer, LE is leukemia, ME is melanoma, OV is ovarian, PR is prostate, and RE is renal.
Figure 5
Figure 5. The “Genetic variant versus drug visualization” web-based tool and output examples.
A. The tool is accessed through our CellMiner web-application at http://discover.nci.nih.gov/cellminer/. B. Within the “NCI-60 Analysis Tools” tab (shown in red), the tool is selected by checking the box in Step 1. The compound and gene identifiers (up to 150 pairs) are entered in Step 2, using NSC numbers for the compounds, and HUGO names for the genes. Enter your email address and click “Get data” in Step 3 to receive the output (as an Excel file). C. The output incudes a bar-plot of the compound activity z scores. The x-axis is the activity z scores, and the y-axis the NCI-60 cell lines ordered by tissue of origin. The tabular output includes the cell lines (in column 1), the compound z scores (in column 2), followed by the amino acid changing variants. Cell lines whose activities or variant status contribute to a statistically significant relationship are indicated by yellow coloring. For the bar plot, brown fills indicate cell lines for which no variant correlates with a shift in drug activity, and the white fill that the cell line has a variant correlated to a shift in the drug activity, but that that cell does not contribute to the correlation. For the tabular data, the purple filled in headers indicate the variant(s) that have significant correlation to the compound activity. The white box indicates that the cell line contains a variant that correlates to the compound, but that that cell line has no significant shift in drug activity (that is it is less than plus or minus 0.5 standard deviations from the mean at 0).
Figure 6
Figure 6. The “Genetic variant summation” tool, and output.
A. The tool is accessed through CellMiner at http://discover.nci.nih.gov/cellminer/, under the “NCI-60 Analysis Tools” tab as described in Figure 5A. The tool is selected in Step 1, and the gene identifiers (up to 150) are entered as HUGO names in Step 2. Enter your email address and click “Get data” in Step 3 to receive the output (as an Excel file). B. The output incudes two versions of the data. The first contains the amino acid changing variants for each input gene. The second contains the subset of these that are included in one of the protein function affecting categories (as defined in Figure 2), and are absent from the non-cancerous 1000 Genomes and ESP5400. Both provide i) chromosome number, ii) nucleotide location and change, iii) amino acid number and change, iv) percent conversion of each cell line for that variant for the NCI-60, and v) the summation of the gene's variants present for each cell line (to a maximum of 100%). The example of KRAS is shown for a subset (due to space constraints) of the cells. C. The tool provides a summation of the variants for all genes in the input. The summary values from B for each gene are added together (with no maximum) to provide a measurement of variant burden (see “Totals”, bottom row). D. The totals from C are used to create a bar graph. The x-axis is the summation of variants values (“Totals” from C). The y-axis is the cell lines, color-coded by tissue of origin , . Several outputs are included for illustration, with the first being from the 6-gene input in A.
Figure 7
Figure 7. Use of the “Genetic variant summation” tool output for pharmacological exploration.
A. The 6-gene input from Figure 6A yields a summation pattern for the NCI-60. Input of this pattern to the “Pattern comparison” tool identifies 12 significantly correlated drugs with known mechanism-of-action, including 8 that target the input pathway. B. By using the different outputs from the “Genetic variant summation” tool from Figure 6D as inputs to “Pattern comparison”, one may identify the minimum and optimal identifiers for the 8 drugs that target the input pathway. C. The molecular pathway from which the input genes were selected, including the targets of the 8 correlated drugs from A and B. The red-filled and blue-filled boxes indicate the drugs that work better, or worse, respectively, in the presence of the genetic variants from A and B.

References

    1. Dyment DA, Cader MZ, Chao MJ, Lincoln MR, Morrison KM, et al... (2012) Exome sequencing identifies a novel, multiple sclerosis susceptibility variant in the TYK2 gene. Neurology. - PMC - PubMed
    1. Doherty D, Bamshad MJ (2012) Exome sequencing to find rare variants causing neurologic diseases. Neurology. - PubMed
    1. Moldovan F, Patten SA, Fendri K, Girard S, Zaouter C, et al. (2012) Exome sequencing identifies novel candidate mutations in idiopathic. Stud Health Technol Inform 176: 453.
    1. Choi BO, Koo SK, Park MH, Rhee H, Yang SJ, et al... (2012) Exome sequencing is an efficient tool for genetic screening of Charcot-Marie-Tooth Disease. Hum Mutat. - PubMed
    1. Johnston JJ, Rubinstein WS, Facio FM, Ng D, Singh LN, et al... (2012) Secondary Variants in Individuals Undergoing Exome Sequencing: Screening of 572 Individuals Identifies High-Penetrance Mutations in Cancer-Susceptibility Genes. Am J Hum Genet. - PMC - PubMed

Publication types

Substances