

Poisson-like spiking in circuits with probabilistic synapses
- PMID: 25032705
- PMCID: PMC4102400
- DOI: 10.1371/journal.pcbi.1003522
Poisson-like spiking in circuits with probabilistic synapses
Abstract
Neuronal activity in cortex is variable both spontaneously and during stimulation, and it has the remarkable property that it is Poisson-like over broad ranges of firing rates covering from virtually zero to hundreds of spikes per second. The mechanisms underlying cortical-like spiking variability over such a broad continuum of rates are currently unknown. We show that neuronal networks endowed with probabilistic synaptic transmission, a well-documented source of variability in cortex, robustly generate Poisson-like variability over several orders of magnitude in their firing rate without fine-tuning of the network parameters. Other sources of variability, such as random synaptic delays or spike generation jittering, do not lead to Poisson-like variability at high rates because they cannot be sufficiently amplified by recurrent neuronal networks. We also show that probabilistic synapses predict Fano factor constancy of synaptic conductances. Our results suggest that synaptic noise is a robust and sufficient mechanism for the type of variability found in cortex.
Conflict of interest statement
The author has declared that no competing interests exist.
Figures
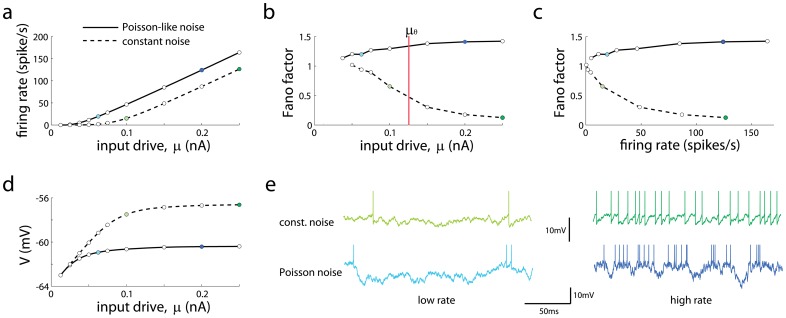
 (solid lines). (b,c) Fano factor as a function of mean input drive (b) and firing rate (c). Vertical red line indicates threshold current
  , defined as the minimal current to elicit firing in absence of input noise. (d) Mean membrane potential as a function of mean input drive. (e) Membrane potential traces corresponding to color dots in the previous panels: low (light green) and high (dark green) firing rate with constant input noise, and low (light blue) and high (dark blue) firing rate with Poisson-like input noise. Low and high firing rates conditions were chosen such that firing rates were comparable for the two input noise types.
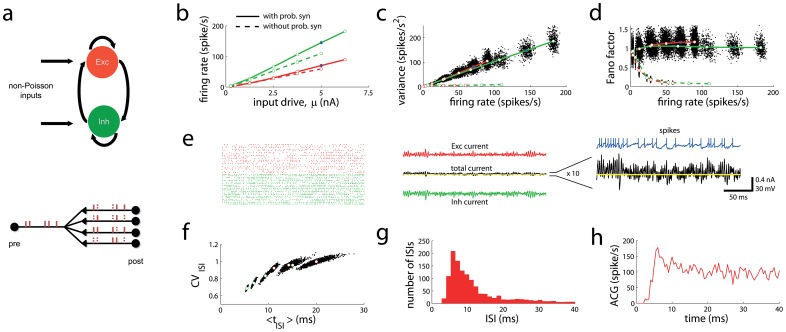
 ,as a function of the mean ISI. (g) Distribution of ISIs for the selected neuron. (h) Auto-correlogram (ACG) of the spike train for that neuron.
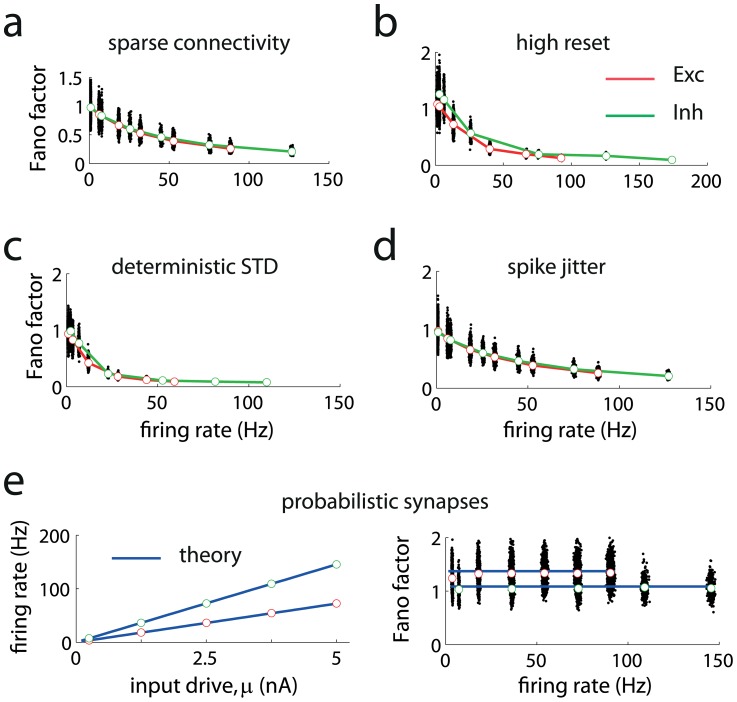
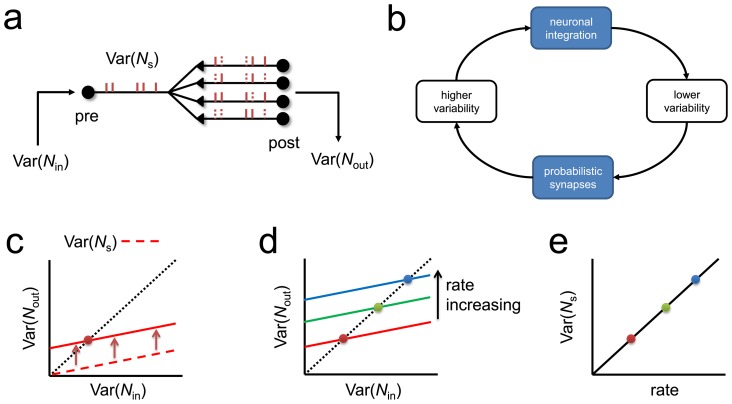
 in the spike counts of the presynaptic spike trains and output variance
  of the post-synaptic currents in an open loop network with probabilistic synapses. (b) Precise balancing of two competing forces in a closed-loop network: the integration step tends to lower spiking variance, while the probabilistic synaptic step increases spiking variability. (c) Output variance (solid red line) and the variance of the spike train,
  (dashed) increase linearly as a function of input variance for fixed input firing rates. Solid line is vertically shifted respect to the dashed line due to the increase of variance by probabilistic synapses, which is uniform for all input variances. The equilibrium point of the network (red point) corresponds to the state where the input and output variances match. (d) The equilibrium point moves linearly with firing rate because the vertical shift induced by probabilistic synapses increases linearly with rate. (e) Spike count variance increases linearly with rate, leading to Fano factor constancy.
References
-
- Tolhurst DJ, Movshon JA, Dean AF (1983) The statistical reliability of signals in single neurons in cat and monkey visual cortex. Vision Res 23: 775–785. - PubMed
Publication types
MeSH terms
LinkOut - more resources
Full Text Sources
Other Literature Sources
