. 2014;8 Suppl 2(Suppl 2):S6.
doi: 10.1186/1752-0509-8-S2-S6. Epub 2014 Mar 13.

Kernel-PCA data integration with enhanced interpretability

Kernel-PCA data integration with enhanced interpretability

Ferran Reverter et al. BMC Syst Biol. 2014.

Abstract

Background: Nowadays, combining the different sources of information to improve the biological knowledge available is a challenge in bioinformatics. One of the most powerful methods for integrating heterogeneous data types are kernel-based methods. Kernel-based data integration approaches consist of two basic steps: firstly the right kernel is chosen for each data set; secondly the kernels from the different data sources are combined to give a complete representation of the available data for a given statistical task.

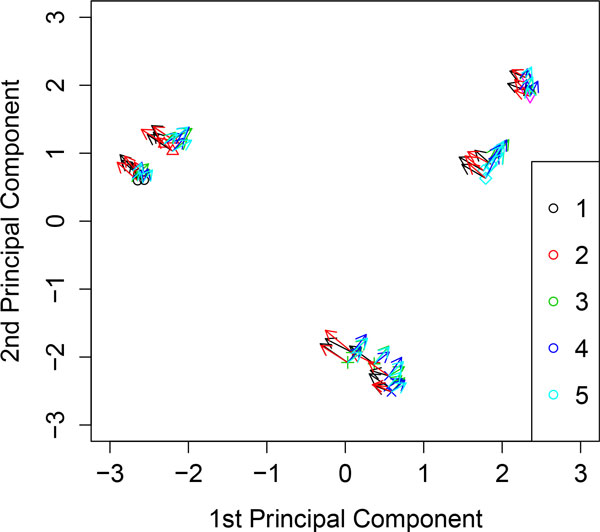
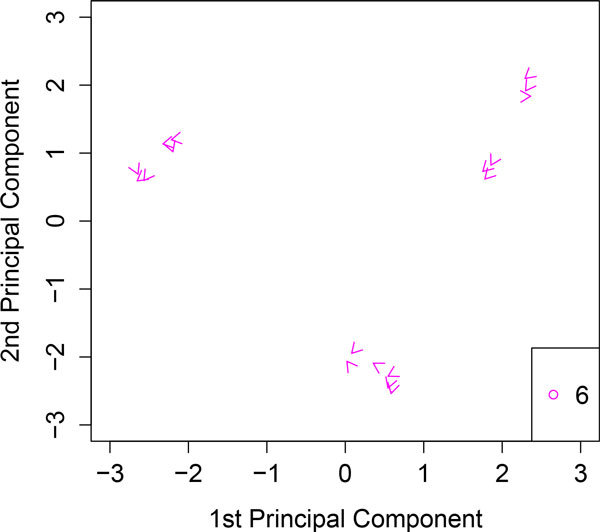
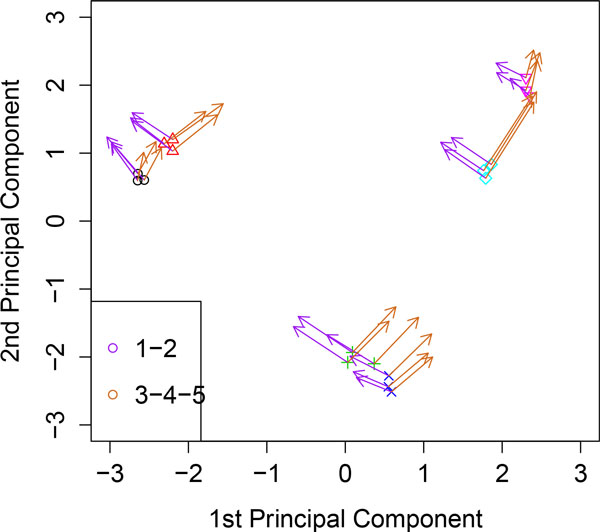
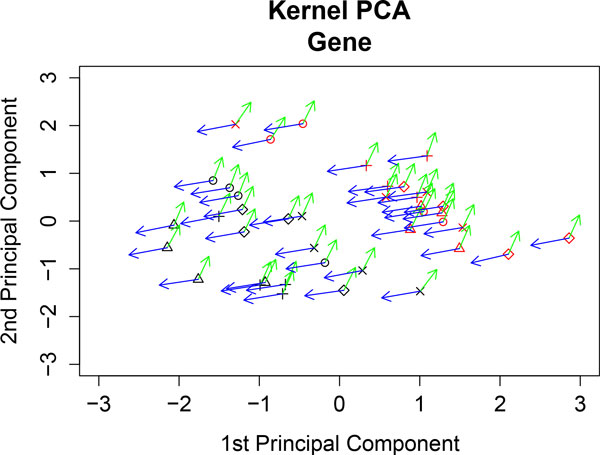
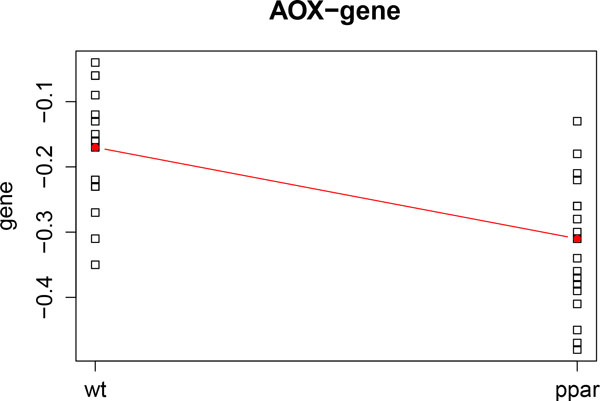
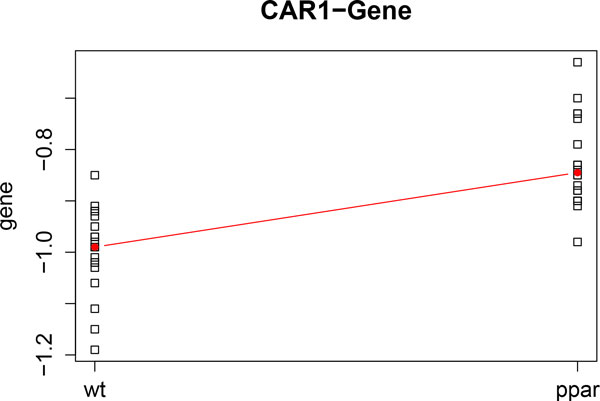
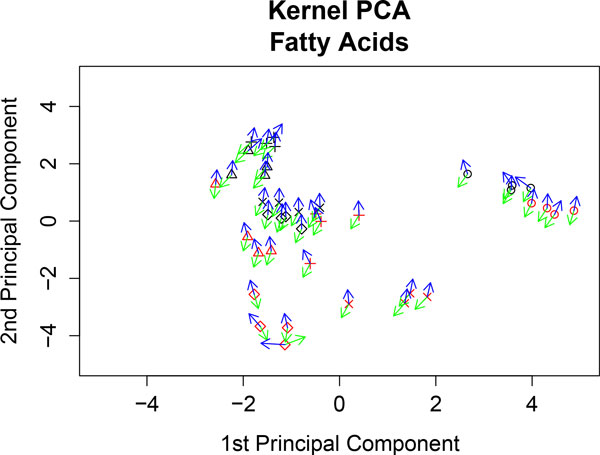
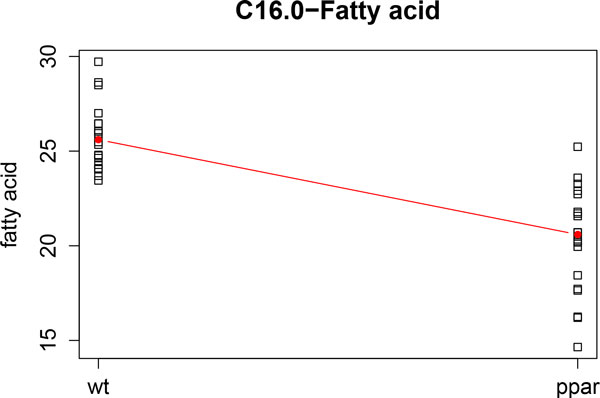
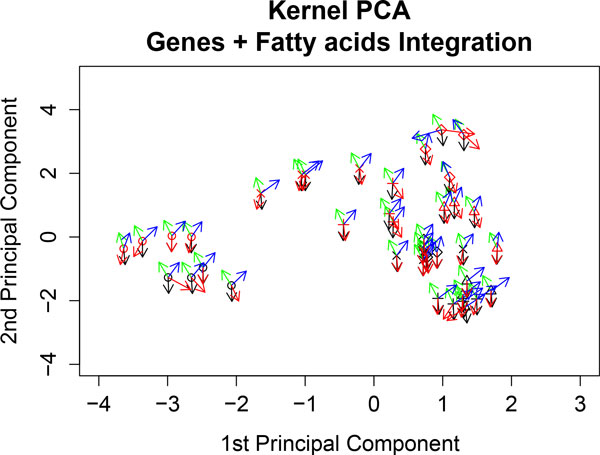
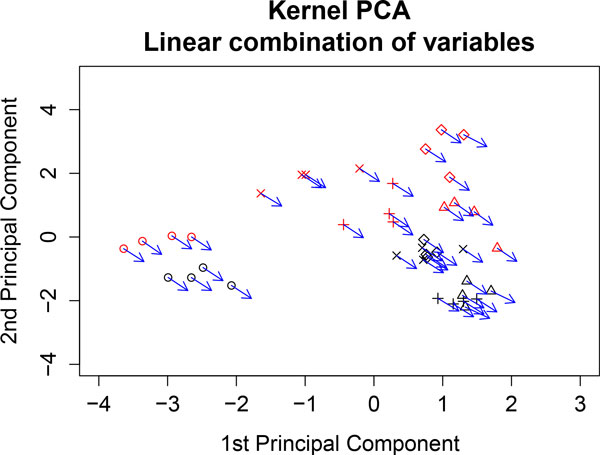
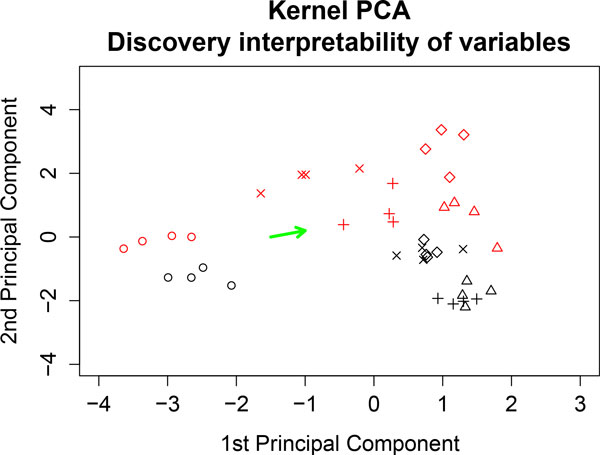
Results: We analyze the integration of data from several sources of information using kernel PCA, from the point of view of reducing dimensionality. Moreover, we improve the interpretability of kernel PCA by adding to the plot the representation of the input variables that belong to any dataset. In particular, for each input variable or linear combination of input variables, we can represent the direction of maximum growth locally, which allows us to identify those samples with higher/lower values of the variables analyzed.

Conclusions: The integration of different datasets and the simultaneous representation of samples and variables together give us a better understanding of biological knowledge.


Figures

Figure 1
Figure 1
Kernel PCA analyzing the toy example. Variables are represented by vectors that indicate the direction of maximum growth in each variable.
Figure 2
Figure 2
Kernel PCA analyzing the toy example. Variable X6 is poorly represented and the direction of maximum growth of this variable shows no trend to any group.
Figure 3
Figure 3
Kernel PCA analyzing the toy example. Linear combinations of variables are represented by vectors that indicate the direction of maximum growth in each of the linear combinations.
Figure 4
Figure 4
Kernel PCA of gene expression. The genes AOX (blue vector) and CAR1 (green vector) are represented at each sample point. WT samples are represented in black and PPAR samples in red. Diet representation is: (ref) diet by the letter x; (coc) diet by circles; (sun) diet by diamonds; (lin) diet by plus signs; and (fish) diet by triangles.
Figure 5
Figure 5
AOX gene profile. Profile of the median gene expression of the AOX gene.
Figure 6
Figure 6
CAR1 gene profile. Profile of the median gene expression of the CAR1 gene.
Figure 7
Figure 7
Kernel PCA of fatty acid concentrations. The fatty acids C16.0 (blue vector) and C20.2ω.6 (green vector) are represented at each sample point. WT samples are represented in black and PPAR samples in red. Diet representation is: (ref) diet by the letter x; (coc) diet by circles; (sun) diet by diamonds; (lin) diet by plus signs; and (fish) diet by triangles.
Figure 8
Figure 8
C16.0 fatty acid profile. Profile of the median concentrations of the C16.0 fatty acid.
Figure 9
Figure 9
C20.2ω.6 fatty acid profile. Profile of the median concentrations of the C20.2ω.6 fatty acid.
Figure 10
Figure 10
Kernel PCA analyzing gene expression and fatty acid concentrations simultaneously. The genes AOX (black vector) and CAR1 (green vector) and fatty acids C20.2ω.6 (blue vector) and C16.0 (red vector) are represented at each sample point. The WT samples are represented in black and the PPAR samples in red. Diet representation is: (ref) diet by the letter x; (coc) diet by circles; (sun) diet by diamonds; (lin) diet by plus signs; and (fish) diet by triangles.
Figure 11
Figure 11
Representation of linear combinations of input variables. The sum of the expression of the genes: GSTpi2, CYP3A11 and CYP2c29 is represented. These genes are associated with detoxification. Wild type samples are represented in black and PPAR samples in red. Diet representation is: (ref) diet by the letter x; (coc) diet by circles; (sun) diet by diamonds; (lin) diet by plus signs; and (fish) diet by triangles.
Figure 12
Figure 12
Kernel PCA analyzing gene expression and fatty acid concentrations simultaneously. The green vector represents variables that are expressed less in samples with the coc diet. It is defined by two cluster centroids: the left-hand cluster is the coc diet; and the right-hand cluster is comprised of the other diets.

References

    1. Gorban AN, Kegl B, Wunsch DC, Zinovyev A. Principal Manifolds for Data Visualization and Dimension Reduction. Springer Publishing Company; 2007.
    1. Pittelkow YE, Wilson SR. Visualisation of Gene Expression Data -the GE-biplot, the Chip-plot and the Gene-plot. Statistical Applications in Genetics and Molecular Biology. 2003. - PubMed
    1. Park M, Lee JW, Lee JB, Song SH. Several biplot methods applied to gene expression data. Journal of Statistical Planning and Inference. 2008;138:500–515. doi: 10.1016/j.jspi.2007.06.019. - DOI
    1. Shawe-Taylor J, Cristianini N. Kernel Methods for Pattern Analysis. Cambridge University Press; 2004.
    1. Scholkopf B, Smola AJ. Learning with Kernels - Support Vector Machines, Regularization, Optimization and Beyond. Cambridge MIT Press; 2002.

Publication types