. 2014 Jul 17;10(7):e1004498.
doi: 10.1371/journal.pgen.1004498. eCollection 2014 Jul.

Microsatellite interruptions stabilize primate genomes and exist as population-specific single nucleotide polymorphisms within individual human genomes

Affiliations

Microsatellite interruptions stabilize primate genomes and exist as population-specific single nucleotide polymorphisms within individual human genomes

Guruprasad Ananda et al. PLoS Genet. .

Abstract

Interruptions of microsatellite sequences impact genome evolution and can alter disease manifestation. However, human polymorphism levels at interrupted microsatellites (iMSs) are not known at a genome-wide scale, and the pathways for gaining interruptions are poorly understood. Using the 1000 Genomes Phase-1 variant call set, we interrogated mono-, di-, tri-, and tetranucleotide repeats up to 10 units in length. We detected ∼26,000-40,000 iMSs within each of four human population groups (African, European, East Asian, and American). We identified population-specific iMSs within exonic regions, and discovered that known disease-associated iMSs contain alleles present at differing frequencies among the populations. By analyzing longer microsatellites in primate genomes, we demonstrate that single interruptions result in a genome-wide average two- to six-fold reduction in microsatellite mutability, as compared with perfect microsatellites. Centrally located interruptions lowered mutability dramatically, by two to three orders of magnitude. Using a biochemical approach, we tested directly whether the mutability of a specific iMS is lower because of decreased DNA polymerase strand slippage errors. Modeling the adenomatous polyposis coli tumor suppressor gene sequence, we observed that a single base substitution interruption reduced strand slippage error rates five- to 50-fold, relative to a perfect repeat, during synthesis by DNA polymerases α, β, or η. Computationally, we demonstrate that iMSs arise primarily by base substitution mutations within individual human genomes. Our biochemical survey of human DNA polymerase α, β, δ, κ, and η error rates within certain microsatellites suggests that interruptions are created most frequently by low fidelity polymerases. Our combined computational and biochemical results demonstrate that iMSs are abundant in human genomes and are sources of population-specific genetic variation that may affect genome stability. The genome-wide identification of iMSs in human populations presented here has important implications for current models describing the impact of microsatellite polymorphisms on gene expression.


Conflict of interest statement

The authors have declared that no competing interests exist.

Figures
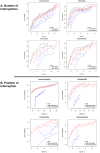
Figure 1
Figure 1. Effect of interruptions on microsatellite mutability in primate genomes.
(A) Mutability of perfect (pure) microsatellites and that of microsatellites with one or two interruptions. (B) Mutability of perfect (pure) microsatellites and that of microsatellites with single interruptions that were located within the middle 25%, or in the fringe 25% (at either 5′ or 3′ end) of the microsatellite length. The number of repeats of a microsatellite was calculated by dividing the total length of the microsatellite, excepting the interrupting nucleotides, by the size of its repeating motif. At each repeat number the lines designate the 2.5th and 97.5th percentiles of empirical distributions that were obtained through bootstrap resampling. The repeats are binned based on their repeat number in the human genome (the reciprocal operation, when binning was based on repeat number in chimpanzee, did not change the results).
Figure 2
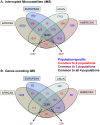
Figure 2. Distribution of interrupted microsatellites in human 1000 genomes populations.
Venn diagram depicting (A) numbers of interrupted microsatellites (iMSs) across the four populations genome-wide, and (B) numbers of genes with iMSs in exons. Tan, blue, green, and red ellipses represent African, European, Asian, and American populations, respectively. Numbers in blue, red, maroon, and black represent counts of population-specific iMSs (absent in the other three), iMSs shared between two populations (and absent in the other two), iMSs shared between three populations (and absent in the fourth), and iMSs common to all populations, respectively.
Figure 3
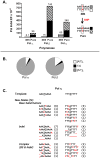
Figure 3. DNA polymerase error rates at interrupted microsatellites corresponding to sequences within the APC gene.
(A). DNA polymerase indel error frequency. The Pol EF for each of the four alleles was determined separately from two independent polymerase reactions per single-stranded template (Table S5). Indel Pol EFs were calculated by multiplying the proportion of unit-based indel mutational events (as examples, [A]8→[A]7 for a perfect allele or A3TA4→A3TA3 for an iMS allele) by the microsatellite Pol EF. Numbers on the top of each column were obtained by adding the Indel Pol EFs of the complementary alleles in order to compare the difference in polymerase fidelity upon introduction of a single nucleotide polymorphism (SNP) that converts the double-stranded iMS sequence to a double-stranded perfect (pure) sequence. (B) Specificity of Pol α and Pol β mutational events within the iMS alleles. Proportions of mutational events found within the three-unit tandem repeat (open sectors), the interrupting base (black sectors), and the four-unit tandem repeat (gray sectors). Total mutational events for pols α and β were 74 and 35, respectively and all were indel events. Two pol α events generated the loss of the interrupting T within the A3TA4 iMS sequence (A3TA4→[A]7 and A3TA4→[A]6). One similar event occurred for pol β at the T3AT4 iMS sequence (T3AT4→[T]4). (C). Pol η mutational events within the iMS alleles generate sequence diversity. Events (71 total) are categorized according to the mutational mechanism that most likely created them. Red indicates individual mutational events. Underline indicates a missing base or bases. Number in parentheses shows the number of mutants carrying the new sequence.
Figure 4
Figure 4. Pathways (substitutions, insertions, and deletions) driving the African population-specific interruptions.
Repeats separated by (A) motif size, (B) repeat number, and (C) motif sequence for mono- and dinucleotides microsatellites.
Figure 5
Figure 5. DNA polymerase interruption mutagenesis within [GT]n and [TC]n dinucleotide microsatellite sequences.
(A) Interruption Pol EFs at the [GT]10, [GT]19, and [TC]11 alleles for B-family (pols α and δ), X-family (pol β) and Y-family (pols κ and η) DNA polymerases. Interruption Pol EFs were calculated from unpublished and published , , , , , data by multiplying the proportion of interruption mutational events at each allele by the microsatellite Pol EF. Only detectable interruptions (ie, interruptions that produce a frameshift or a stop codon) were included in this analysis given that an event must be detectable to contribute toward the Pol EF. Less than symbol (<) indicates that no interruption events were found for pol α at the [GT]10 allele; the interruption Pol EF is estimated to be <5.7×10⁻⁵. The Pol EF was not determined for Pol α or Pol η using the GT19 template. (B) DNA polymerases utilize signature interruption mechanisms. Pie charts depict the proportion of mutational events generated by each possible interruption mechanism at [GT]n and [TC]n alleles. Graphs include both detectable and undetectable interruptions. Data used in the [GT]n chart is a compilation of interruption events from pol β (N = 32) at [GT]10, [GT]13, and [GT]19, pol κ (N = 36) at [GT]10, [GT]13, and [GT]19, and pol η (N = 29) at [GT]10. The [TC]n chart includes events from pol β (N = 11) at [TC]11 and [TC]14, pol κ (N = 21) at [TC]11 and [TC]14, and pol η (N = 58) at [TC]11. See Supplementary Figures S7 and S8 for complete representation of interruption mutations. (C) Detailed specificity of interruption events at [GT]n and [TC]n microsatellites. Columns in blue indicate the proportion of total interruptions that are single base deletions. Columns in red indicate the proportion that are single base insertions and columns in black/gray indicate the proportion that are base substitutions. Data used for this analysis is the same as that used in (B) for pols β, κ, and η. Data in combined column indicates the specificity obtained upon combining data from all three polymerases.

References

    1. Lander ES, Linton LM, Birren B, Nusbaum C, Zody MC, et al. (2001) Initial sequencing and analysis of the human genome. Nature 409: 860–921. - PubMed
    1. Ellegren H (2004) Microsatellites: simple sequences with complex evolution. Nat Rev Genet 5: 435–445. - PubMed
    1. Pearson CE, Nichol Edamura K, Cleary JD (2005) Repeat instability: mechanisms of dynamic mutations. Nat Rev Genet 6: 729–742. - PubMed
    1. Legendre M, Pochet N, Pak T, Verstrepen KJ (2007) Sequence-based estimation of minisatellite and microsatellite repeat variability. Genome Res 17: 1787–1796. - PMC - PubMed
    1. Gemayel R, Vinces MD, Legendre M, Verstrepen KJ (2010) Variable tandem repeats accelerate evolution of coding and regulatory sequences. Annu Rev Genet 44: 445–477. - PubMed

Publication types