. 2014 Jul 17;10(7):e1004275.
doi: 10.1371/journal.ppat.1004275. eCollection 2014 Jul.

Motility and chemotaxis mediate the preferential colonization of gastric injury sites by Helicobacter pylori

Affiliations

Motility and chemotaxis mediate the preferential colonization of gastric injury sites by Helicobacter pylori

Eitaro Aihara et al. PLoS Pathog. .

Abstract

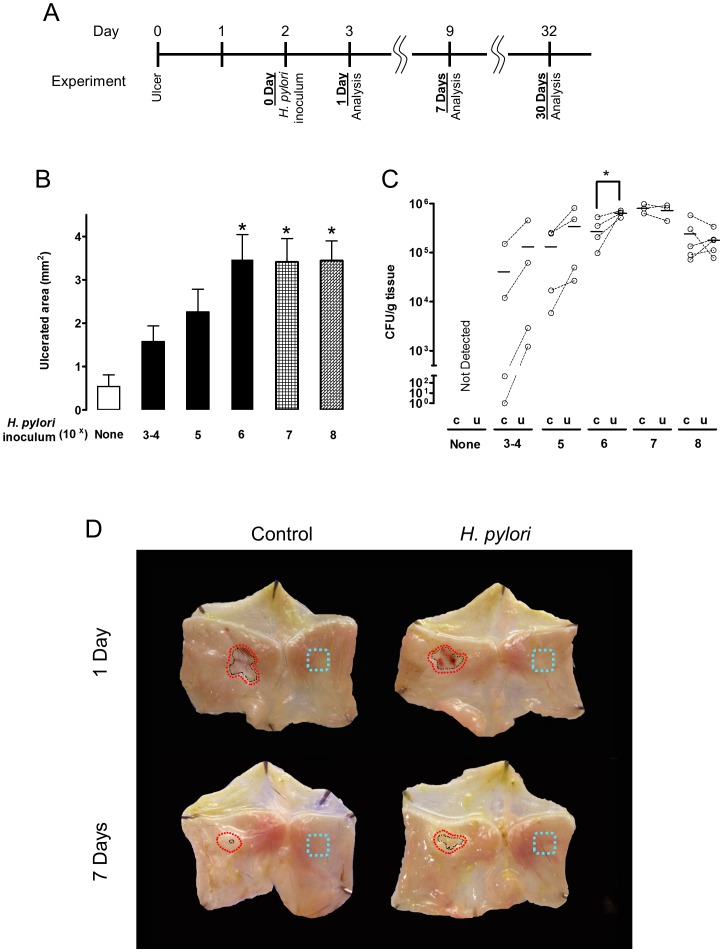
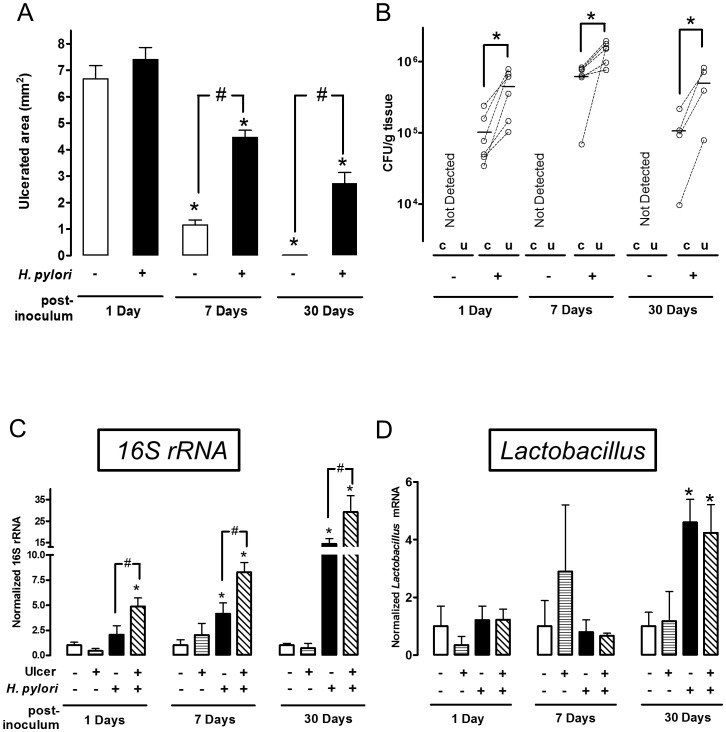
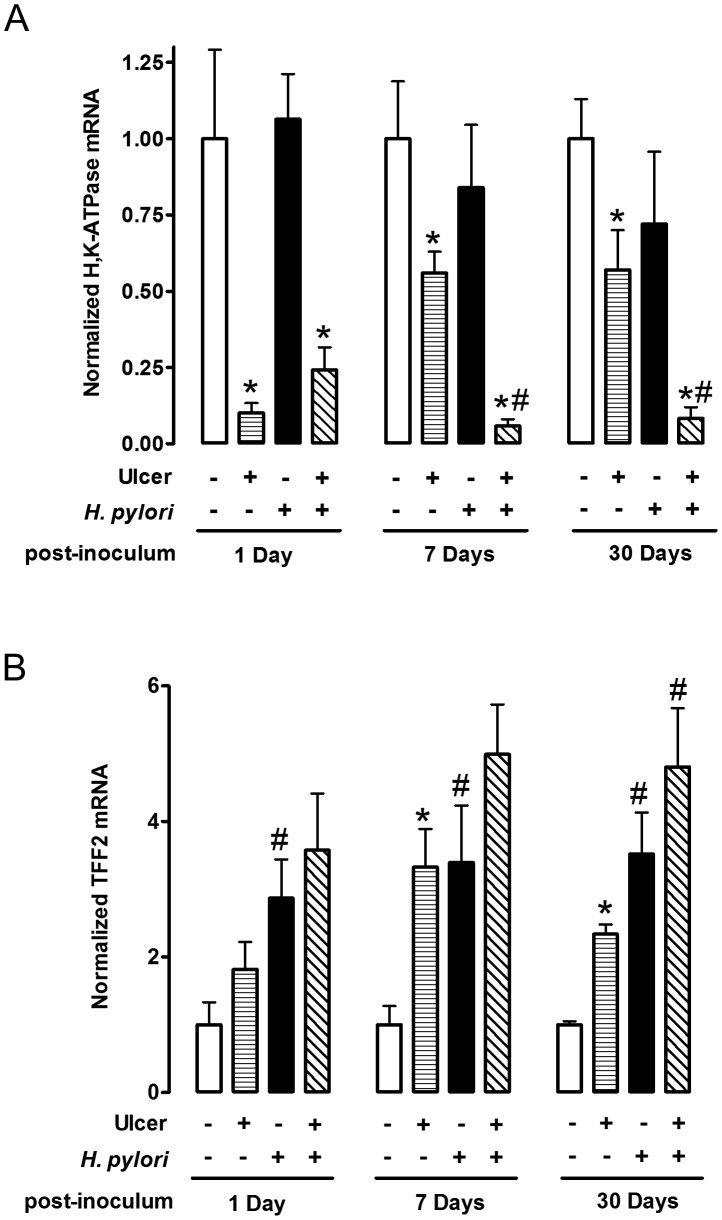
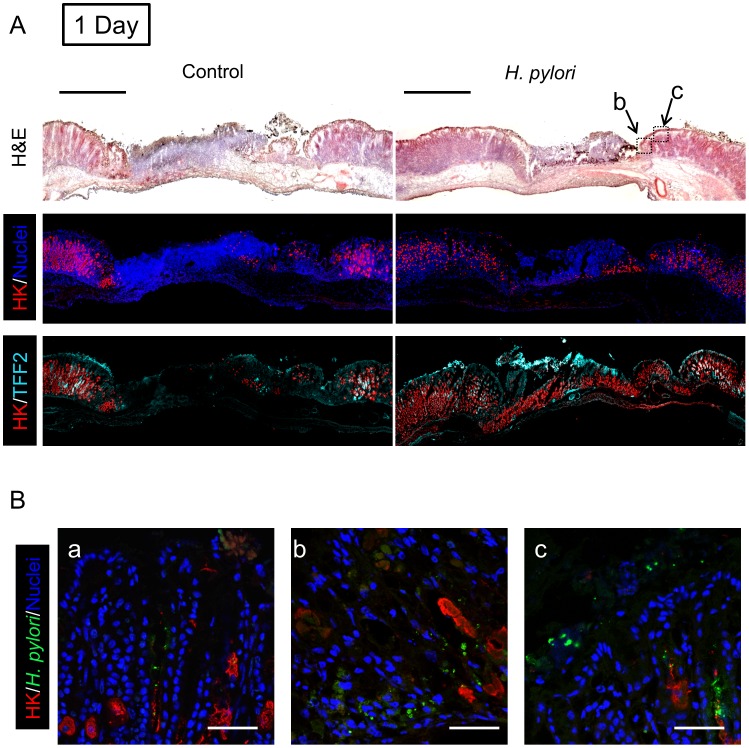
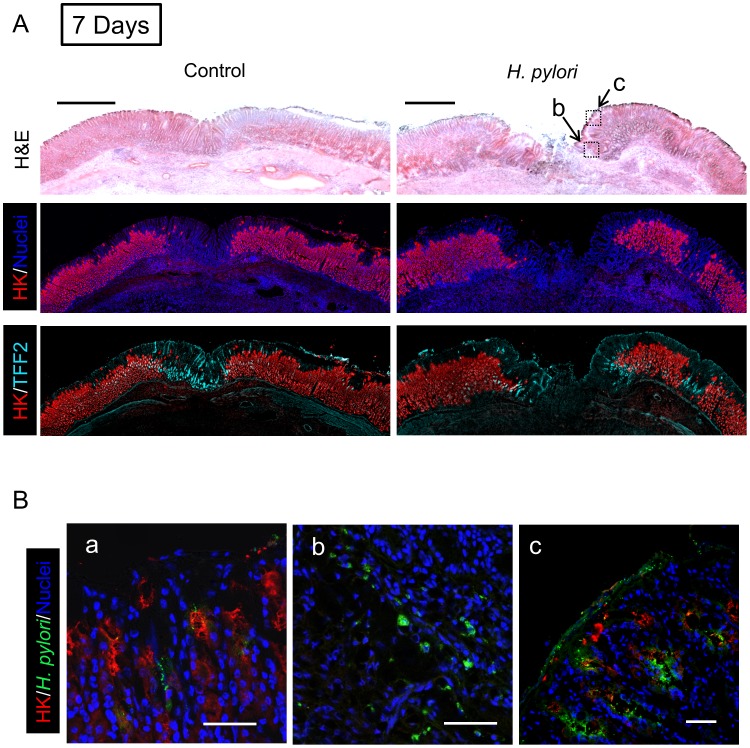
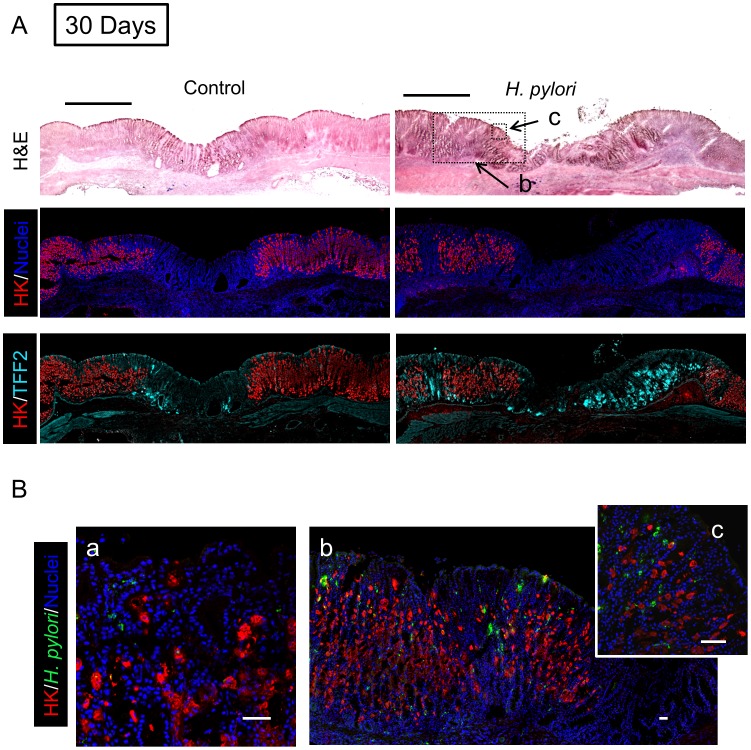
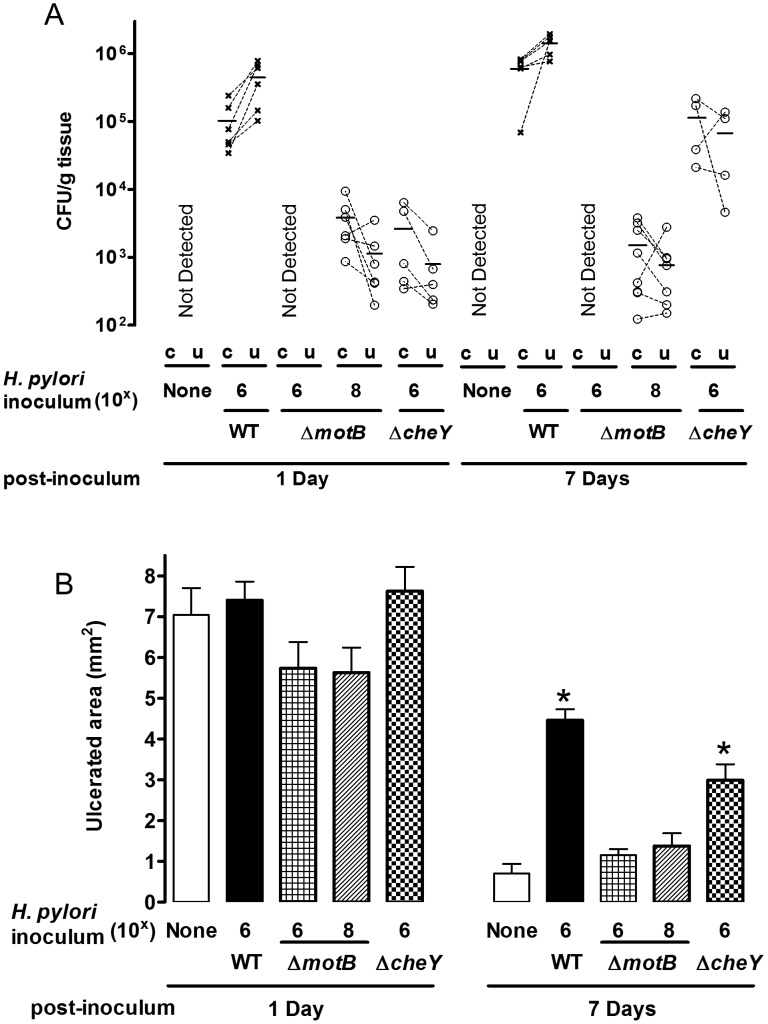
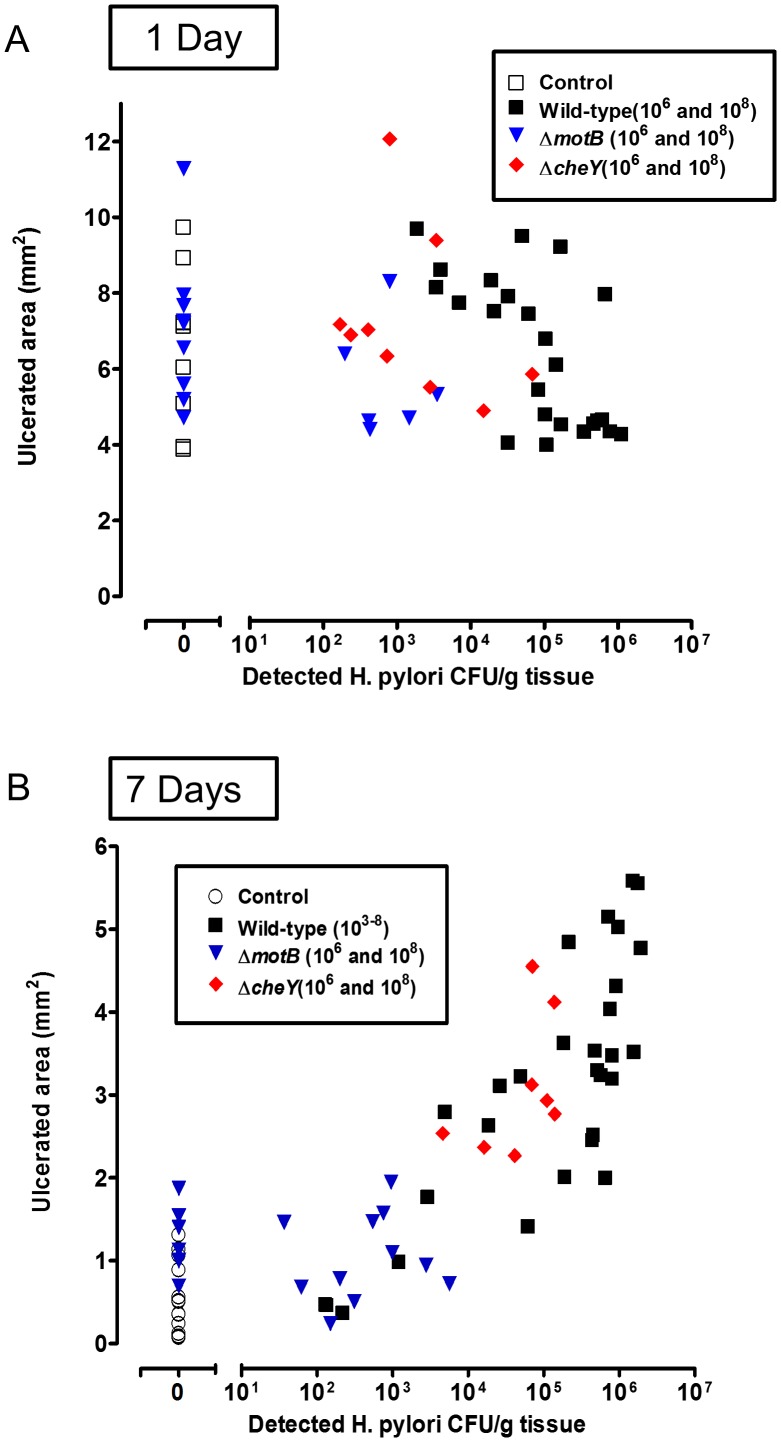
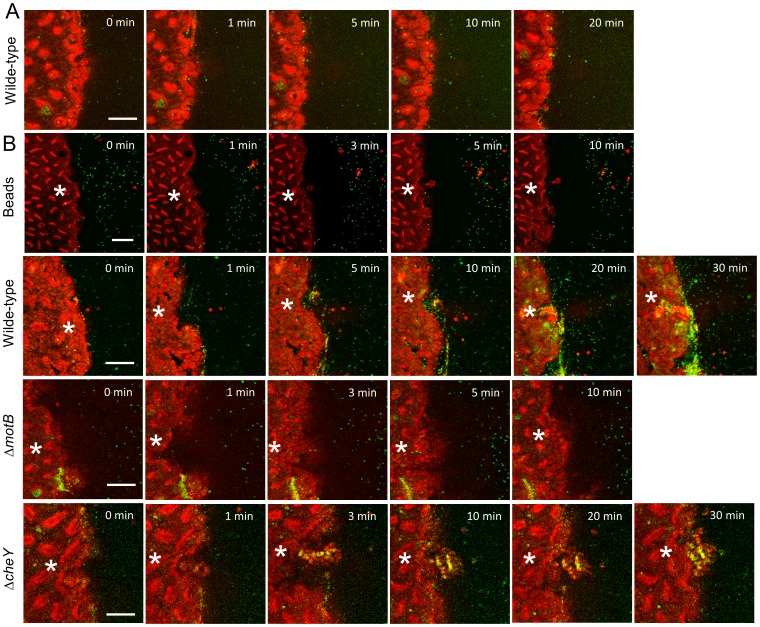
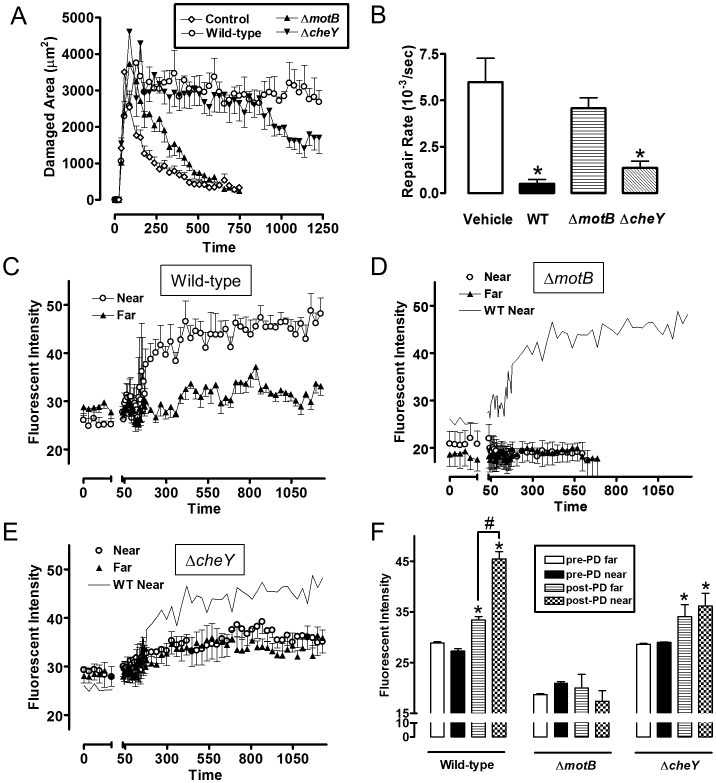
Helicobacter pylori (H. pylori) is a pathogen contributing to peptic inflammation, ulceration, and cancer. A crucial step in the pathogenic sequence is when the bacterium first interacts with gastric tissue, an event that is poorly understood in vivo. We have shown that the luminal space adjacent to gastric epithelial damage is a microenvironment, and we hypothesized that this microenvironment might enhance H. pylori colonization. Inoculation with 106 H. pylori (wild-type Sydney Strain 1, SS1) significantly delayed healing of acetic-acid induced ulcers at Day 1, 7 and 30 post-inoculation, and wild-type SS1 preferentially colonized the ulcerated area compared to uninjured gastric tissue in the same animal at all time points. Gastric resident Lactobacillus spp. did not preferentially colonize ulcerated tissue. To determine whether bacterial motility and chemotaxis are important to ulcer healing and colonization, we analyzed isogenic H. pylori mutants defective in motility (ΔmotB) or chemotaxis (ΔcheY). ΔmotB (10(6)) failed to colonize ulcerated or healthy stomach tissue. ΔcheY (10(6)) colonized both tissues, but without preferential colonization of ulcerated tissue. However, ΔcheY did modestly delay ulcer healing, suggesting that chemotaxis is not required for this process. We used two-photon microscopy to induce microscopic epithelial lesions in vivo, and evaluated accumulation of fluorescently labeled H. pylori at gastric damage sites in the time frame of minutes instead of days. By 5 min after inducing damage, H. pylori SS1 preferentially accumulated at the site of damage and inhibited gastric epithelial restitution. H. pylori ΔcheY modestly accumulated at the gastric surface and inhibited restitution, but did not preferentially accumulate at the injury site. H. pylori ΔmotB neither accumulated at the surface nor inhibited restitution. We conclude that bacterial chemosensing and motility rapidly promote H. pylori colonization of injury sites, and thereby biases the injured tissue towards sustained gastric damage.


Conflict of interest statement

The authors have declared that no competing interests exist.

Figures

Figure 1
Figure 1. Effect of different amounts of H. pylori inoculation on gastric ulcer healing.
(A) Schematic of experimental timeline, reconciling the potential confusion of counting days from ulceration versus days after H. pylori inoculation. A single gavage of 1×10³–108 H. pylori was performed 2 days after ulcer induction. Gastric ulcer size (B) or H. pylori CFU (C) was measured 7 Days post-inoculum. Mean ± SEM (n = 4–5). *, p<0.05 vs. uninfected control (none H. pylori). (D) Gross morphology at experimental day 3 and 9 after ulceration (Day 1 or Day 7 after inoculation with 106 H. pylori). Control tissue was uninfected. Black dotted lines indicate ulcer crater (macroscopic area lacking epithelium that is measured by digital caliper to evaluate ulcer size). Red dotted lines or blue dotted lines shows the location that collected for H. pylori or RT-PCR analysis as ulcerated area or intact area, respectively.
Figure 2
Figure 2. Time course of bacterial colonization and H. pylori effects on gastric ulcer healing.
Gastric ulcer was induced by topical application of acetic acid to the exterior surface of the surgically exposed stomach. Where indicated (H. pylori +) a single gavage of 1×10⁶ H. pylori was performed 2 days after ulcer induction. Tissue was evaluated 1 (n = 6), 7 (n = 6) or 30 (n = 4) Days after H. pylori inoculation. (A) Gastric ulcer size was measured by calipers. Mean ± SEM. *, p<0.05 vs. Day 1; #, p<0.05 vs. no H. pylori control group. (B) Harvested ulcerated (u) or non-ulcerated control (c) gastric tissue was collected as depicted in Figure 1D, homogenized and H. pylori cultured on Columbia blood agar plate to obtain CFU. Data are presented as CFU/g tissue, with lines connecting tissue from the same animal to indicate trends. Significant difference at *, p<0.05 vs. intact region. PCR Detection of 16S rRNA (C: total bacteria) or Lactobacillus (D), and data shown as fold change normalized to non-ulcerated control region of uninfected group (ulcer −, H. pylori −). mean ± SEM. *, p<0.05 vs. non-ulcerated control.
Figure 3
Figure 3. Effect of H. pylori on gene expression change during ulcer healing.
Gastric ulcer was induced by topical serosal application of acetic acid. A single gavage of 106 H. pylori was performed 2 days after ulcer induction. Ulcerated or non-ulcerated area were harvested 1, 7 or 30 Days after H. pylori inoculation. H,K-ATPase (A), and TFF2 (B) mRNA was detected by real-time PCR. Data are shown as fold change normalized to non-ulcerated region of uninfected group (ulcer −, H. pylori −). mean ± SEM. *, p<0.05 vs. intact region. #, p<0.05 vs. no H. pylori inoculation group.
Figure 4
Figure 4. Morphology of gastric ulcerated tissue 1 day after H. pylori inoculation.
Gastric ulcer was induced by topical serosal application of acetic acid. In some animals, a single gavage of 106 SS1 H. pylori was performed 2 days after ulcer induction. Gastric tissue was isolated 3 days after ulcer induction (1 Day after H. pylori inoculum), and serial sections processed as described in Methods. Results are compared from the same tissue and sectioning series, although adjacent sections are not always presented. (A) Sections of uninfected (control) or H. pylori infected tissues are compared. Images show H&E staining, dual staining for H,K-ATPase (HK: red) and cell nuclei (blue), and dual stain for H,K-ATPase (HK: red) and TFF2 (cyan). Bar = 1 mm. (B) Tissue was also stained for H. pylori. Higher magnification of serial sections from (a) non-ulcerated corpus region of H. pylori infected stomach, or (b, c) around inset area (Z-focal plane ± 50 µm) indicated in A (H&E staining). Cell nuclei (blue), H. pylori (green), H,K-ATPase (HK: red). Bar = 50 µm.
Figure 5
Figure 5. Morphology of gastric ulcerated tissue 7 days after H. pylori inoculation.
Gastric tissue was isolated 9 days after ulcer induction (7 Days after H. pylori inoculum), and serial sections processed as described in Methods. (A) Sections of uninfected (control) or H. pylori infected tissues are compared as in Figure 4. Bar = 1 mm. (B) Tissue was also stained for H. pylori, and results presented as in Figure 4. Higher magnification of serial sections from (a) non-ulcerated corpus region of H. pylori infected stomach, or (b, c) around inset area indicated in A. Bar = 50 µm.
Figure 6
Figure 6. Morphology of gastric ulcerated tissue 30 days after H. pylori inoculation.
Gastric tissue was isolated 32 days after ulcer induction (30 Days after H. pylori inoculum), and serial sections processed as described in Methods. (A) Sections of uninfected (control) or H. pylori infected tissues are compared as in Figure 4. Bar = 1 mm. (B) Tissue was also stained for H. pylori, and results presented as in Figure 4. Higher magnification of serial sections from (a) non-ulcerated corpus region of H. pylori infected stomach, or (b, c) around inset area indicated in A. Bar = 50 µm.
Figure 7
Figure 7. Effect of ΔmotB and ΔcheY mutant H. pylori on gastric ulcer healing.
Gastric ulcer was induced by topical serosal application of acetic acid. A single gavage of 106 or 108 ΔmotB (n = 6), or 106 ΔcheY (n = 4–6) H. pylori was performed 2 days after ulcer induction. Wild-type H. pylori data from Figure 2 are included for comparison. Ulcerated (u) or non-ulcerated control area (c) were harvested 1 or 7 Days after H. pylori inoculation. (A) Harvested gastric tissue was homogenized and H. pylori cultured on plates to obtain CFU/g tissue, with lines connecting tissue from the same animal to indicate trends. (B) Gastric ulcer size was measured. Mean ± SEM. *, p<0.05 vs. uninfected control.
Figure 8
Figure 8. Relationship between ulcer size and H. pylori abundance.
All data collected from all acetic acid ulceration experiments in this paper at (A) 1 Day or (B) 7 Days after H. pylori inoculation with the indicated strain. Results correlate the measured ulcer size vs H. pylori CFU/g tissue in the ulcerated area from the same mouse. Each data point is from a separate mouse.
Figure 9
Figure 9. H. pylori accumulation near gastric surface after microscopic damage.
Fluorescently labeled H. pylori or beads were added to luminal fluid bathing the exposed gastric mucosa. Two-photon damage was imposed on a microscopic region of the epithelium as described in Methods. Images show representative time course of confocal imaging of beads or H. pylori (green) in parallel with confocal reflectance (red), without (A) or with (B) photodamage (damage site indicated by asterisk) imposed directly after time zero. As indicated, each time series shows outcomes tracking labeled beads, H. pylori SSI (wild-type), ΔmotB, or ΔcheY. Bar = 50 µm.
Figure 10
Figure 10. Quantifying effect of H. pylori on gastric epithelial repair after microscopic damage, and the localization of H. pylori during repair.
Experiments were performed as in Figure 9, and results compiled. All results mean ± SEM. (A) Time course of the measured damage area, in the presence or absence of the indicated H. pylori strain. n = 5–8 damage/repair cycles (B) Rate of repair measured as described in Methods, in the presence or absence of the indicated H. pylori strain. *, p<0.05 vs vehicle. (C–E) measures of fluorescence intensity of the indicated H. pylori strains measured in the luminal space < 50 µm from the photodamage (PD) site (Near) or >100 µm from the damage site (Far). wild-type (n = 8), ΔmotB (n = 6), ΔcheY (n = 6). (F) Analysis of results from panels C–E. Fluorescent intensity values measured directly prior to damage (pre) and 10 min after damage. *, p<0.05 vs same region pre-PD. #, p<0.05 near vs. far.

References

    1. Marshall BJ, Warren JR (1984) Unidentified curved bacilli in the stomach of patients with gastritis and peptic ulceration. Lancet 1: 1311–1315. - PubMed
    1. Ottemann KM, Lowenthal AC (2002) Helicobacter pylori uses motility for initial colonization and to attain robust infection. Infect Immun 70: 1984–1990. - PMC - PubMed
    1. Terry K, Williams SM, Connolly L, Ottemann KM (2005) Chemotaxis plays multiple roles during Helicobacter pylori animal infection. Infect Immun 73: 803–811. - PMC - PubMed
    1. Lertsethtakarn P, Ottemann KM, Hendrixson DR (2011) Motility and chemotaxis in Campylobacter and Helicobacter. Annu Rev Microbiol 65: 389–410. - PMC - PubMed
    1. Mizote T, Yoshiyama H, Nakazawa T (1997) Urease-independent chemotactic responses of Helicobacter pylori to urea, urease inhibitors, and sodium bicarbonate. Infect Immun 65: 1519–1521. - PMC - PubMed

MeSH terms