. 2014 Jul 17;10(7):e1003711.
doi: 10.1371/journal.pcbi.1003711. eCollection 2014 Jul.

Enhanced regulatory sequence prediction using gapped k-mer features

Affiliations

Enhanced regulatory sequence prediction using gapped k-mer features

Mahmoud Ghandi et al. PLoS Comput Biol. .

Erratum in

  • PLoS Comput Biol. 2014 Dec;10(12):e1004035

Abstract

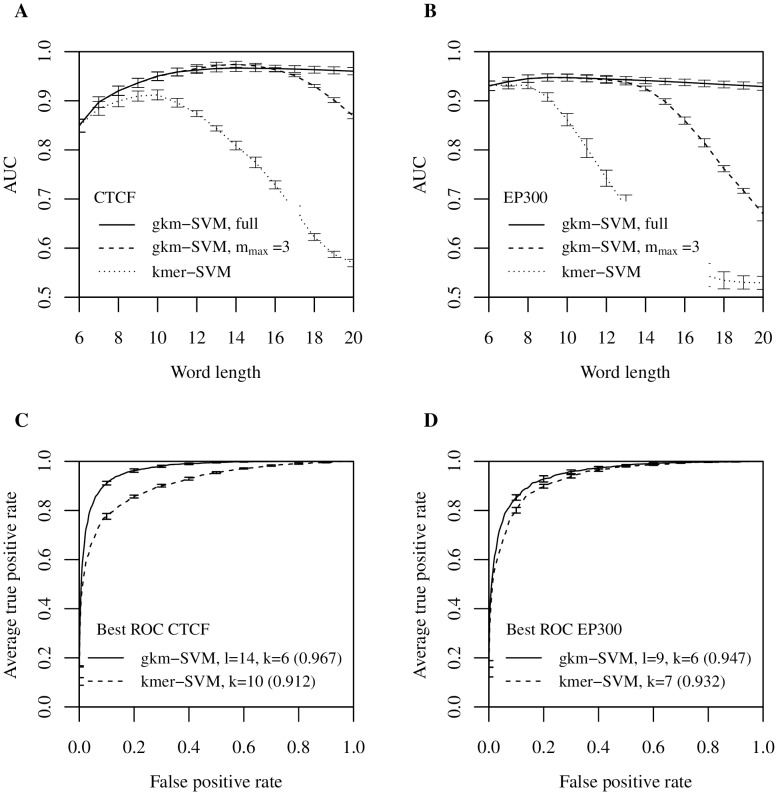
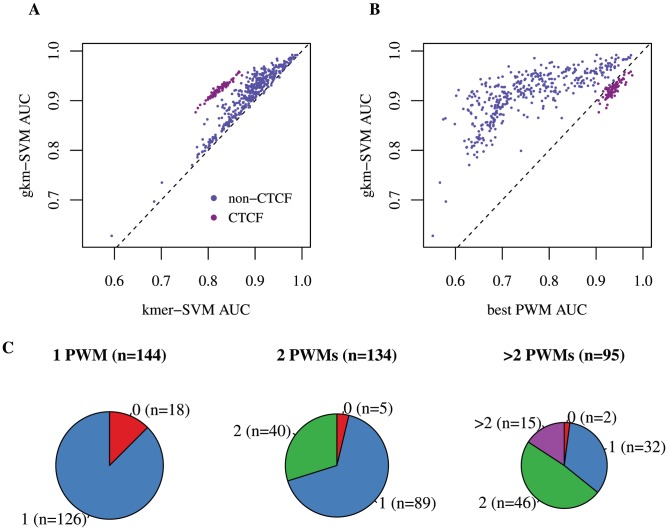
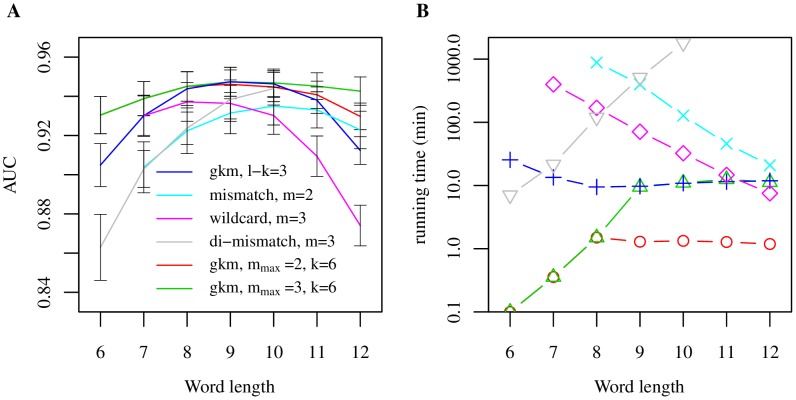
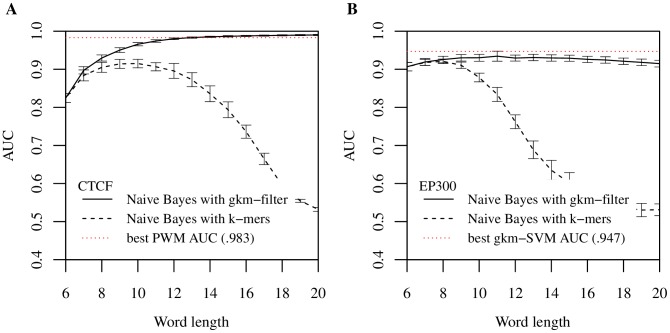
Oligomers of length k, or k-mers, are convenient and widely used features for modeling the properties and functions of DNA and protein sequences. However, k-mers suffer from the inherent limitation that if the parameter k is increased to resolve longer features, the probability of observing any specific k-mer becomes very small, and k-mer counts approach a binary variable, with most k-mers absent and a few present once. Thus, any statistical learning approach using k-mers as features becomes susceptible to noisy training set k-mer frequencies once k becomes large. To address this problem, we introduce alternative feature sets using gapped k-mers, a new classifier, gkm-SVM, and a general method for robust estimation of k-mer frequencies. To make the method applicable to large-scale genome wide applications, we develop an efficient tree data structure for computing the kernel matrix. We show that compared to our original kmer-SVM and alternative approaches, our gkm-SVM predicts functional genomic regulatory elements and tissue specific enhancers with significantly improved accuracy, increasing the precision by up to a factor of two. We then show that gkm-SVM consistently outperforms kmer-SVM on human ENCODE ChIP-seq datasets, and further demonstrate the general utility of our method using a Naïve-Bayes classifier. Although developed for regulatory sequence analysis, these methods can be applied to any sequence classification problem.


Conflict of interest statement

The authors have declared that no competing interests exist.

Figures

Figure 1
Figure 1. gkm-SVM outperforms kmer-SVM over a wide range of k-mer length.
Both gkm-SVM and kmer-SVM were trained on (A) CTCF bound and (B) EP300 bound genomic regions using different word lengths (k for kmer-SVM and l for gkm-SVM). The parameter k for gkm-SVM was fixed at 6. While AUCs of the kmer-SVMs show significant overfitting in both cases as k gets larger (dotted), gkm-SVMs accuracy is higher for a broad range of larger l (solid). Results using the truncated Gkm-SVM with m max = 3 are shown as dashed lines and AUCs of these faster approximations are comparable when the difference between mmax and lk are relatively small. ROC for the optimal k or l for each case are shown in (C) and (D). Gkm-SVMs (solid) consistently outperform kmer-SVMs (dashed) on both data sets. Error bars here and below represent 5-fold CV standard deviation.
Figure 2
Figure 2. gkm-SVM consistently outperforms kmer-SVM and the best known PWM on human ENCODE ChIP-seq data sets.
(A) We trained gkm-SVM and kmer-SVM on the complete set of 467 ENCODE ChIP-seq data sets (with k = 6 for kmer-SVM, and l = 10 and k = 6 for gkm-SVM). gkm-SVM AUC is consistently higher than kmer-SVM with only a few very minor exceptions. The gkm-SVM method specially outperforms the kmer-SVM for the data sets bound by members of the CTCF complex, highlighted as purple circles. (B) We also compared gkm-SVM and the best known PWM on the same data sets, and gkm-SVM AUCs are significantly higher than the PWM AUC in almost all cases. (C) The ENCODE data sets were divided into four groups: (1) no PWM, (2) only one PWM, (3) two PWMs, and (4) three or more PWMs identified by Wang et al. Then, for each group except the first one, we calculated the number of PWMs recovered by our method. At least one PWM was recovered for more than ∼90% of the data sets.
Figure 3
Figure 3. Comparison of gkm-SVM and existing methods on the mouse forebrain EP300 data set.
(A) For each method, averages of 5-CV AUCs are shown as a function of the word length with the optimal number of mismatches, m, held fixed. Also shown are gkm-SVM results using fixed k = 6 and varying m max. (B) Running time for each of the kernel computations shown in (A). Gkm-kernels show better classification performance and significantly more efficient computation at peak AUC.
Figure 4
Figure 4. Gapped k-mer features also improve performance of Naïve-Bayes classifiers.
Naïve-Bayes classifiers were trained on (A) CTCF bound and (B) EP300 bound genomic regions using different word lengths, k, using both actual k-mer counts (dashed), and estimated k-mer counts from the gkm-filter (solid). As shown above for SVM, the Naïve-Bayes accuracy as measured by AUC is systematically higher using gapped k-mer estimated frequencies instead of actual k-mer counts, further supporting the utility of gapped k-mer based features. For CTCF the Naïve-Bayes AUC is comparable to the best SVM (dotted red lines), but for EP300 the SVM outperforms the Naïve-Bayes classifier.
Figure 5
Figure 5. Fast computation of mismatch profiles using k-mer tree structure.
As an example, we use l = 3 and three sequences S1 = AAACCC, S2 = AAAAA, and S3 = ACC to build the k-mer tree. The leaves (nodes at depth d = l = 3) correspond to 3-mers AAA, AAC, ACC, and CCC. The sequence ID and the number of times each 3-mer appeared in each sequence are stored for each leaf. Each node ti at depth d represents a sequence of length d, denoted by s(ti), which is determined by the path from the root of the tree to ti. For example, s(t2) = C and s(t4) = AC. DFS is started at the root node, t0. When visiting each node ti, at depth d, we compute the list of all the nodes tj at depth d for which s(ti) and s(tj) have at most mmax mismatches. We also compute the number of mismatches between s(ti) and s(tj). When reaching a leaf, we increment the corresponding mismatch profile Nm(Si, Sj) for each pair of sequences Si in that leaf and Sj in the list.

References

    1. Manolio TA (2010) Genomewide Association Studies and Assessment of the Risk of Disease. N Engl J Med 363: 166–176 10.1056/NEJMra0905980 - DOI - PubMed
    1. Maurano MT, Humbert R, Rynes E, Thurman RE, Haugen E, et al. (2012) Systematic Localization of Common Disease-Associated Variation in Regulatory DNA. Science 337: 1190–1195 10.1126/science.1222794 - DOI - PMC - PubMed
    1. Lee D, Karchin R, Beer MA (2011) Discriminative prediction of mammalian enhancers from DNA sequence. Genome Res 21: 2167–2180 10.1101/gr.121905.111 - DOI - PMC - PubMed
    1. Stormo GD (2000) DNA binding sites: representation and discovery. Bioinformatics 16: 16–23 10.1093/bioinformatics/16.1.16 - DOI - PubMed
    1. Beer MA, Tavazoie S (2004) Predicting Gene Expression from Sequence. Cell 117: 185–198. - PubMed

Publication types

MeSH terms

Substances