. 2014 Jul 17;55(8):4832-41.
doi: 10.1167/iovs.14-14802.

Quantitative autofluorescence and cell density maps of the human retinal pigment epithelium

Affiliations

Quantitative autofluorescence and cell density maps of the human retinal pigment epithelium

Thomas Ach et al. Invest Ophthalmol Vis Sci. .

Abstract

Purpose: Lipofuscin (LF) accumulation within RPE cells is considered pathogenic in AMD. To test whether LF contributes to RPE cell loss in aging and to provide a cellular basis for fundus autofluorescence (AF) we created maps of human RPE cell number and histologic AF.

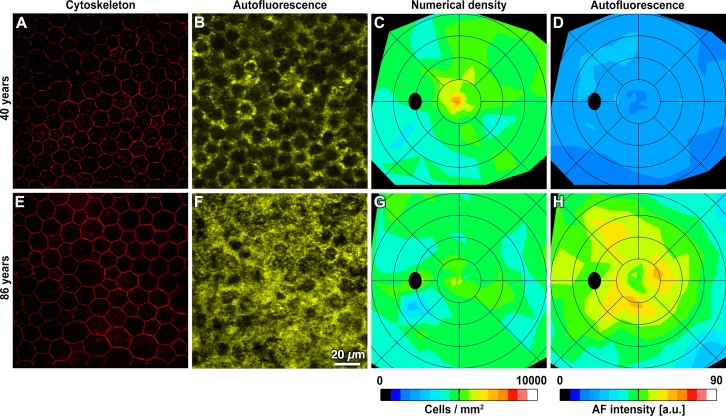
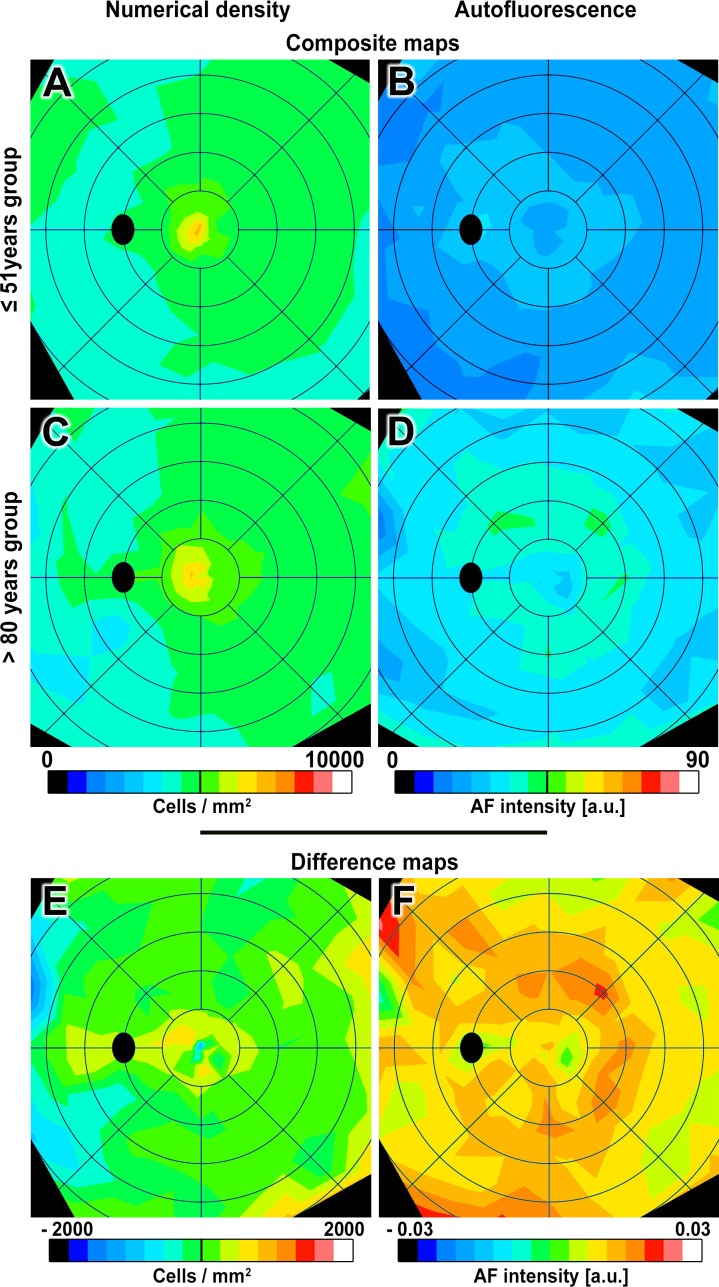
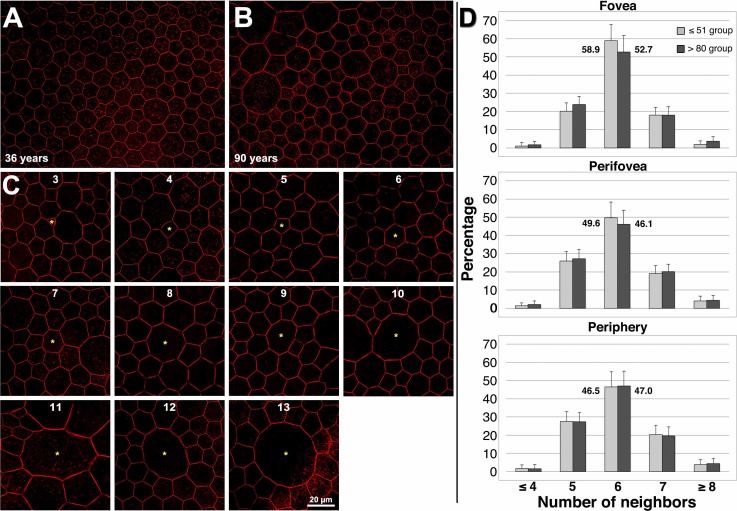
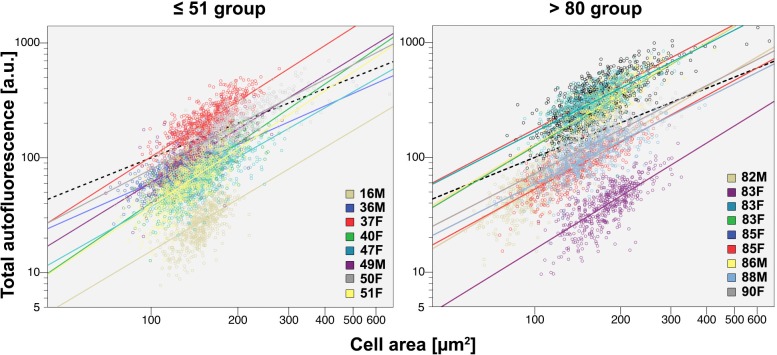
Methods: Retinal pigment epithelium-Bruch's membrane flat mounts were prepared from 20 donor eyes (10 ≤ 51 and 10 > 80 years; postmortem: ≤4.2 hours; no retinal pathologies), preserving foveal position. Phalloidin-binding RPE cytoskeleton and LF-AF (488-nm excitation) were imaged at up to 90 predefined positions. Maps were assembled from 83,330 cells in 1470 locations. From Voronoi regions representing each cell, the number of neighbors, cell area, and total AF intensity normalized to an AF standard was determined.

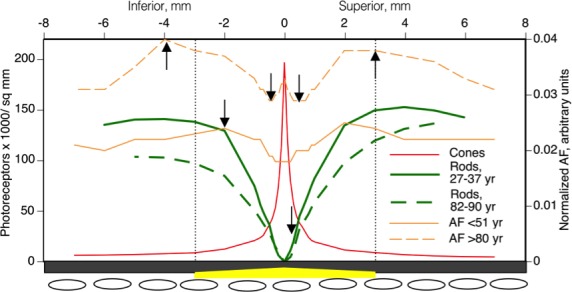
Results: Highly variable between individuals, RPE-AF increases significantly with age. A perifoveal ring of high AF mirrors rod photoreceptor topography and fundus-AF. Retinal pigment epithelium cell density peaks at the fovea, independent of age, yet no net RPE cell loss is detectable. The RPE monolayer undergoes considerable lifelong re-modeling. The relationship of cell size and AF, a surrogate for LF concentration, is orderly and linear in both groups. Autofluorescence topography differs distinctly from the topography of age-related rod loss.

Conclusions: Digital maps of quantitative AF, cell density, and packing geometry provide metrics for cellular-resolution clinical imaging and model systems. The uncoupling of RPE LF content, cell number, and photoreceptor topography in aging challenges LF's role in AMD.

Keywords: autofluorescence; cytoskeleton; lipofuscin; photoreceptor; retinal pigment epithelium.


Figures

Figure 1
Figure 1
Retinal pigment epithelium–BrM flat-mount cytoskeleton and AF images are the basis for numerical density and AF maps. Representative micrographs and digital maps show two donors at different ages. For each map, RPE flat mounts were imaged at 75 to 90 predefined locations in an unbiased sampling pattern (Supplementary Table S2). At each location, cytoskeleton imaging ([A, E] fovea is shown) was followed by lipofuscin AF imaging (B, F). Single RPE cells are delimited by labeled cytoskeleton (A, E). Autofluorescence values were normalized by a reference standard. The RPE layer shows variable AF (B, F), because the lipofuscin load differs from cell to cell, and because other organelles occupy space and block signal transmission (e.g., nuclei in the middle and melanosomes in the apical 1/3). Retinal pigment epithelium numerical density (C, G) peaks in the foveal center, decreases with eccentricity, and is similar in these age groups. Autofluorescence intensity (D, H) is highest outside the foveal center in a perifoveal annulus and is higher in the older eye. Maps are displayed as left eyes, and rings are centered on the fovea and at intervals of 2 mm. The black oval represents the optic disk. Maps of all study eyes are presented in Supplementary Figures S4 and S5.
Figure 2
Figure 2
Composite and difference maps of RPE numerical density and AF. Composite and difference maps of numerical density and AF (AF intensity of human RPE in individuals ≤ 51 years and > 80 years). Composite maps (AD): RPE numerical density peaks at the fovea (≤ 51: 6520 ± 946 cells/mm2; >80: 6405 ± 1323 cells/mm2) and decreases with eccentricity in both age groups (Supplementary Table S4). An annulus of intense AF localizes to the perifovea in both age groups, corresponding to highest rod densities (Supplementary Fig. S6) but slightly lower in inferior nasal quadrant. Difference maps (EF): warm colors indicate higher values, and cool colors indicate lower values in the older group. Green indicates minimal differences between groups. The numerical density difference map shows no significant age change at fovea and periphery and a significant increase in cell density with age in the perifovea (details in Supplementary Table S4). The AF difference map shows significantly increased intensity in all regions with age, especially at 2 to 4 mm from the foveal center. Difference maps display the mean of all pair-wise differences between eyes each of the locations analyzed in flat mounts. Excluding the youngest donor (16 years) from the analysis did not change the results. Color bar for differences in numerical density ranges between −2000 and +2000 cells in increments of 250 cells/mm2. Color bar for differences in AF intensity ranges between −0.3 and +0.3 in increments of 0.0375 arbitrary units (a.u.). Other visualization conventions are the same as in Figure 1.
Figure 3
Figure 3
Retinal pigment epithelium cell packing geometry reflects monolayer remodeling over the lifespan. (A, B) Perifoveal RPE cells in a younger adult are mostly hexagonal in shape, with six neighbors, whereas cells in an older adult, while still polygonal, have a more variable number of neighbors. (A) A 36-year-old male donor, perifovea; (B) A 90-year-old female donor, perifovea. For illustrative purposes, red was manually sharpened and brightened in (A, B) using Photoshop CS6 (Adobe, San Jose, CA, USA). (C) Retinal pigment epithelium cells have 3 to 13 neighbors. Cells deviant from six neighbors can be found in both age groups. Phalloidin-labeling of actin cytoskeleton is shown. (D) Hexagonal cells are most frequent (>50%) in the fovea, and decrease in frequency (<50%) with increasing eccentricity from the fovea, confirming in vivo findings in humans by Morgan and colleagues. With age, the number of cells with six neighbors decreases significantly in the fovea and perifovea. In contrast, in the fovea, the number of cells with five neighbors increases significantly, while in the perifovea the number of cells with five and seven neighbors increases significantly. Cell density, mean cell area, and number of neighbors (Supplementary Table S4) indicate RPE cell re-arrangement occurs throughout life (Supplementary Table S3). To highlight the differences in six-neighbored cells, the exact percentages are plotted next to the columns.
Figure 4
Figure 4
The relationship between total AF and cell area is a measure of lipofuscin concentration and how it is regulated. Total AF per cell increases with increasing cell size in both age groups. The slopes (ΔAF/Δcell area) do not change significantly with age at the fovea and perifovea (fovea: P = 0.5662, perifovea: P = 0.5299). Slopes are significantly steeper in the periphery (P < 0.0001) for the younger than 80-years group. This could be explained by more densely packed AF granules or loss of light blocking melanosomes or, most likely, the recent observation that concentration of A2E, an abundant lipofuscin fluorophore, rises toward the retinal edge, where it is maximal. The relationship ΔAF/Δcell area is a measure of the concentration of lipofuscin-attributable AF in individual cells. The plot shows total AF (a.u.) per cell versus cell area (μm2) on a double logarithmic scale for illustrative clarity, for both age groups. Fovea, a region representative of other locations (for this measure, is shown (Supplementary Table S5). Total AF is the sum of AF intensities of all pixels bounded by cytoskeleton of an individual RPE cell. Autofluorescent granules within RPE cells are stacked rather than lying in a plane. Therefore, AF is expressed as a planimetric density (Supplementary Fig. S3). Each circle represents a single cell. In total, more than 83,300 cells were analyzed (Supplementary Table S2). Linear fits are plotted for every tissue. Foveal data were not available from all 20 tissues.
Figure 5
Figure 5
The topographies of age-related RPE-AF increase and photoreceptor loss in aging human retina are not obviously related., Normalized AF along the vertical meridian from the 51 years or younger and the 80 years or older groups in the current study and spatial density photoreceptors along the same meridian from youngest adult group in Curcio et al. are shown. Cone density was not shown to change with aging in the 1993 study and is illustrated for the oldest group only. Dotted line delimits the macula. The RPE-BrM-choriocapillaris complex is depicted schematically on the lower x-axis. An age-related accumulation in lipoproteins in BrM, believed to contribute to a transport barrier between choroidal vasculature and outer retinal cells,, and is thickest under the fovea (yellow). Arrows indicate the highest proportional change for rod density and RPE-AF. Retinal pigment epithelium–AF increases most near the perifoveal rod ring and the foveal cone peak. Rod loss is worst where cone density is stable, and where an accumulation in BrM that would affect transport to both photoreceptor types is also abundant (yellow).

References

    1. Ferris FL, Fine SL, Hyman L. Age-related macular degeneration and blindness due to neovascular maculopathy. Arch Ophthalmol. 1984; 102: 1640–1642 - PubMed
    1. Vingerling JR, Dielemans I, Hofman A, et al. The prevalence of age-related macuolpathy in the Rotterdam study. Ophthalmology. 1995; 102: 205–210 - PubMed
    1. Friedman DS, O'colmain BJ, Munoz B, et al. Prevalence of age-related macular degeneration in the United States. Arch Ophthalmol. 2004; 122: 564–572 - PubMed
    1. Williams RA, Brody BL, Thomas RG, Kaplan RM, Brown SI. The psychosocial impact of macular degeneration. Arch Ophthalmol. 1998; 116: 514–520 - PubMed
    1. Strauss O. The retinal pigment epithelium in visual function. Physiol Rev. 2005; 85: 845–881 - PubMed

Publication types