. 2014 Aug;42(14):9131-45.
doi: 10.1093/nar/gku590. Epub 2014 Jul 17.

Genomic organization and evolution of double minutes/homogeneously staining regions with MYC amplification in human cancer

Affiliations

Genomic organization and evolution of double minutes/homogeneously staining regions with MYC amplification in human cancer

Alberto L'Abbate et al. Nucleic Acids Res. 2014 Aug.

Abstract

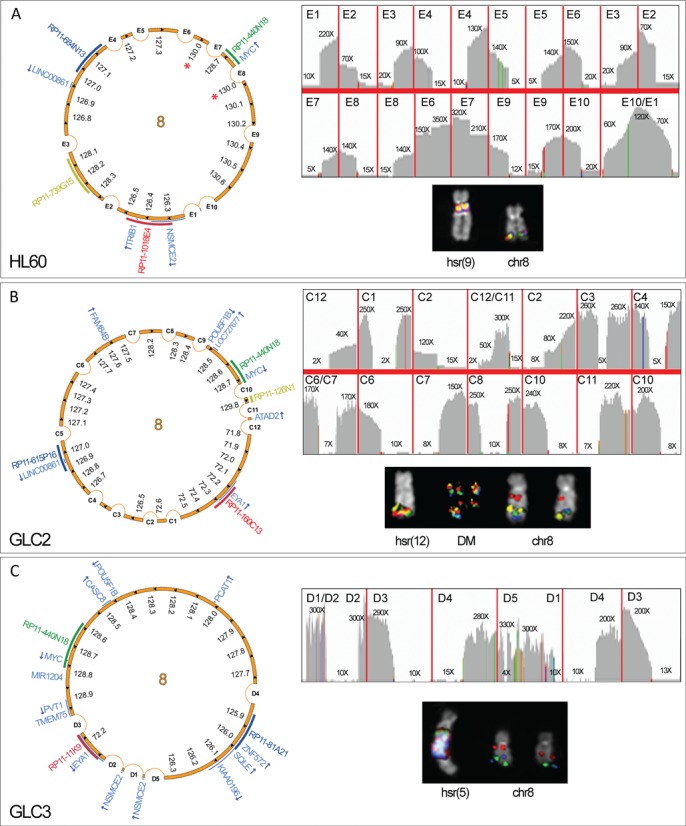
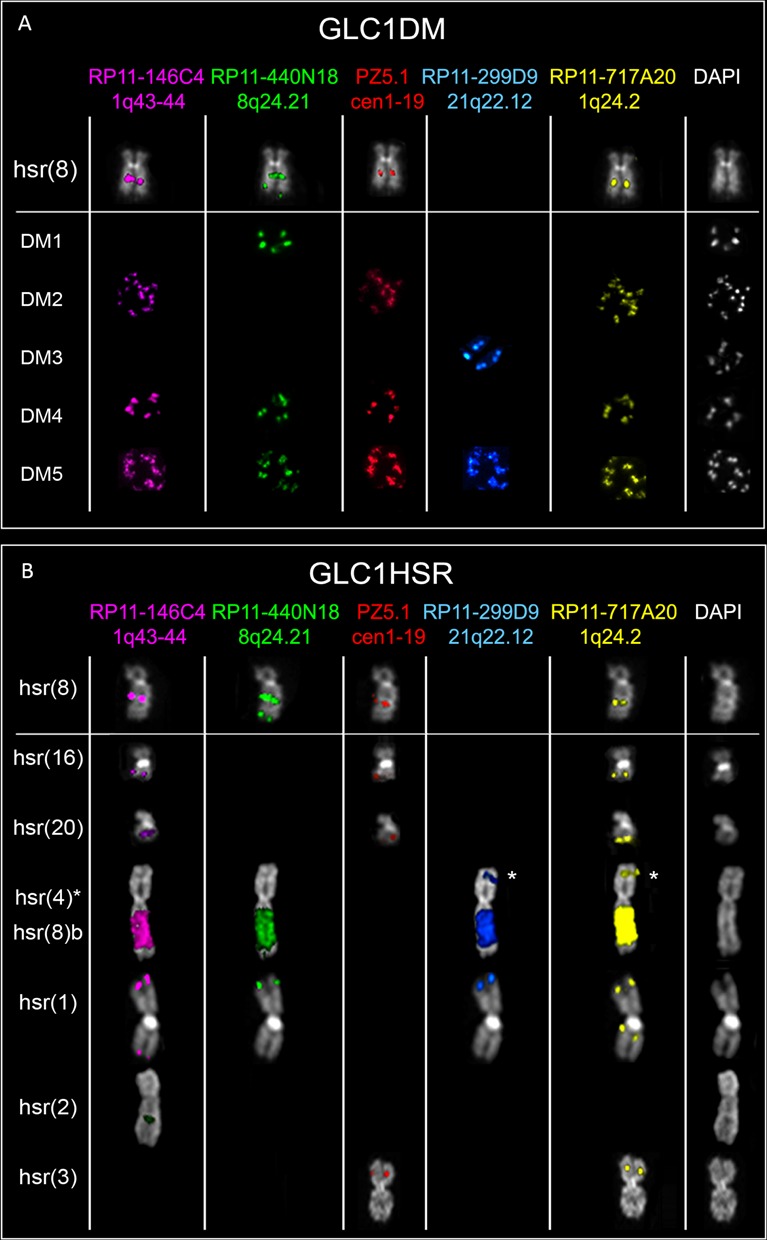
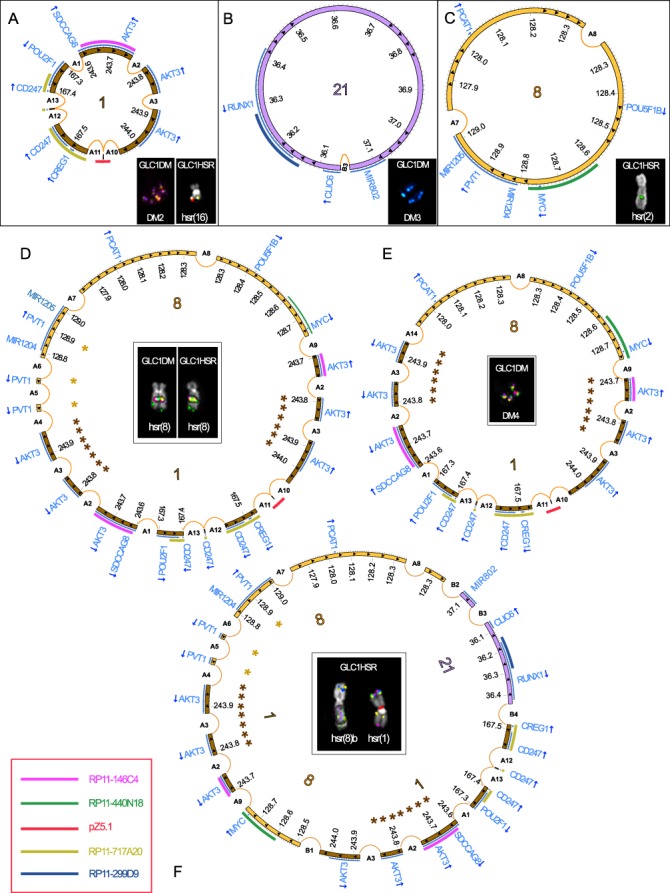
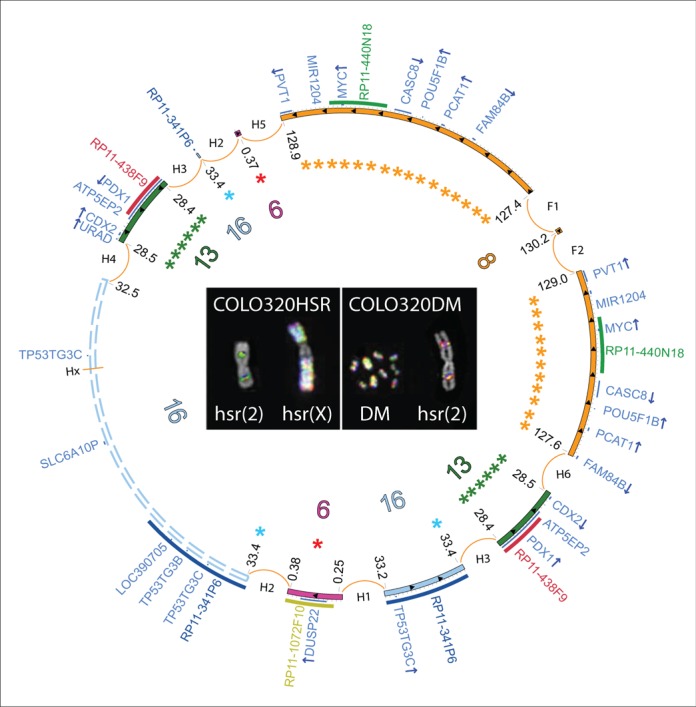
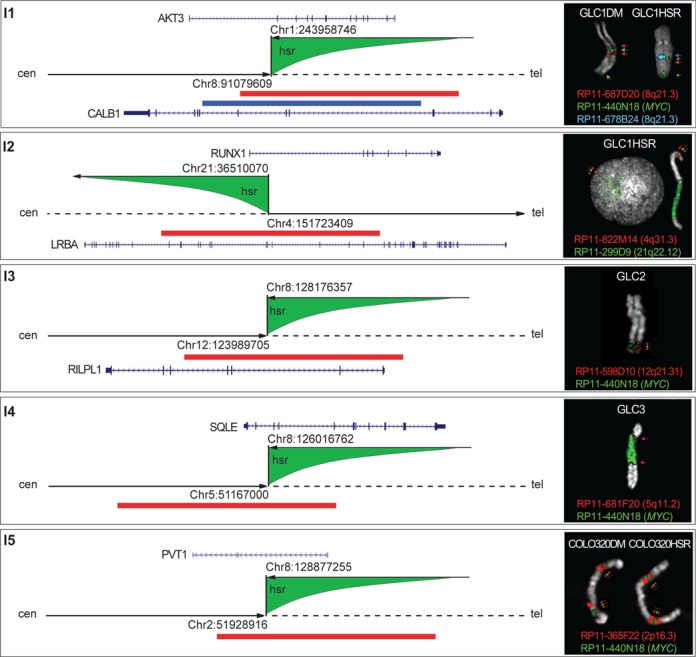
The mechanism for generating double minutes chromosomes (dmin) and homogeneously staining regions (hsr) in cancer is still poorly understood. Through an integrated approach combining next-generation sequencing, single nucleotide polymorphism array, fluorescent in situ hybridization and polymerase chain reaction-based techniques, we inferred the fine structure of MYC-containing dmin/hsr amplicons harboring sequences from several different chromosomes in seven tumor cell lines, and characterized an unprecedented number of hsr insertion sites. Local chromosome shattering involving a single-step catastrophic event (chromothripsis) was recently proposed to explain clustered chromosomal rearrangements and genomic amplifications in cancer. Our bioinformatics analyses based on the listed criteria to define chromothripsis led us to exclude it as the driving force underlying amplicon genesis in our samples. Instead, the finding of coexisting heterogeneous amplicons, differing in their complexity and chromosome content, in cell lines derived from the same tumor indicated the occurrence of a multi-step evolutionary process in the genesis of dmin/hsr. Our integrated approach allowed us to gather a complete view of the complex chromosome rearrangements occurring within MYC amplicons, suggesting that more than one model may be invoked to explain the origin of dmin/hsr in cancer. Finally, we identified PVT1 as a target of fusion events, confirming its role as breakpoint hotspot in MYC amplification.


Figures

Figure 1.
Figure 1.
Circular amplicon structures in HL-60, GLC2 and GLC3 cell lines. Image showing HL-60 (A), GLC2 (B) and GLC3 (C) amplicon structure. Asterisks represent nested amplicons. For each cell line, top right panel: IGV plot of NGS read depth for recurrent amplicon SVs; left panel: scaled Circos plots showing the circular structure of the overall amplicons, with internal arrows indicating amplicon orientation, and genes in pale blue (arrows represent the transcriptional orientation); bottom right panel: FISH pseudocolor images showing co-localizing amplified probes, consistently colored as in the Circos plot.
Figure 2.
Figure 2.
Heterogeneous dmin/hsr structure in GLC1DM/HSR cell lines. Partial metaphases showing FISH results obtained using the probes listed on the top. Each row refers to an amplicon population in GLC1DM (A) and GLC1HSR (B). The asterisk indicates hsr(4), mapping within a chromosome 4p joined to the 8q harboring hsr(8)b. (A) hsr at 8q21 [hsr(8)], shared by the two lines, showing the co-localization of all chromosomes 1q and 8q24 amplicons; DM1 containing only 8q24 amplifications; DM2 showing co-amplification of all 1q amplicons; DM3 with amplification of only 21q22.12 sequences; DM4 displaying the co-amplification of sequences found in DM1–2 dmin subgroups; DM5 with the co-localization of DM1–3 dmin amplified sequences together; (B) hsr(8) (see above in A); two hsr on 16q and 20q [hsr(16) and hsr(20), respectively], both positive for chromosome 1 sequences only (including alphoid DNA); a hsr within the long arm of one chromosome 4 [hsr(4)] (labeled with an asterisk), translocated, at its short arm, to a segment of chromosome 8q, harboring a second hsr [hsr(8)b]; a hsr within the short arm of one chromosome 1 [hsr(1)], showing co-localization of 1q (without alpha-satellite), 8q and 21q sequences; a hsr in 2q [hsr(2)], positive only for 8q24 probes; a hsr within the short arm of chromosome 3 [hsr(3)], with co-amplification of 1q24.2 and alphoid sequences.
Figure 3.
Figure 3.
Circular amplicon structures in GLC1DM/HSR cell lines. Scaled Circos plots representing the amplicon structure of dmin/hsr in GLC1DM/HSR. Chromosomes 1, 8 and 21 fragments are shown by brown, yellow and purple innermost circular panels, respectively. Internal arrows indicate the amplicon orientation. Consistently colored asterisks represent nested amplicons. Genes are in pale blue, with arrows corresponding to their transcriptional orientation. Each pseudocolor FISH image shows the co-localizing amplified probes listed in the legend (bottom-left), consistently colored in the outermost semicircular panels of Circos plots. (A–C) Tandemly amplified segments originating from single chromosomes (1, 21 and 8, respectively). (D, E) Circular arrays of co-amplified chromosomes 1 and 8 segments [hsr(8) and DM4, respectively, in d and e]. (F) Co-amplification of chromosomes 1, 8 and 21 regions, inferred as a head-to-tail amplicon, in hsr(8)b and hsr(1) in GLC1HSR.
Figure 4.
Figure 4.
Circular amplicon structures shared by COLO320DM/HSR cell lines. Unscaled Circos plot representing the overall amplicon structure shared by COLO320DM/HSR. Chromosomes 6, 8, 13 and 16 fragments are shown as purple, yellow, green and light blue inner circular segments, respectively. Internal arrows indicate amplicon orientation. Asterisks indicate nested amplicons. Dashed lines represent the ambiguous structure of the 16p11.2 amplicon. Genes are in dark blue, with arrows corresponding to their transcriptional orientation. FISH images show co-localizing amplified probes, consistently colored in the outermost semicircular panels of the Circos plots.
Figure 5.
Figure 5.
Schematic representation of the hsr insertion sites mapped at the nucleotide level. Each corresponding SV is top-left reported. Arrowhead and dashed dark lines indicate the distal and proximal side of each insertion site along the hosting chromosome, respectively; green shapes represent the inserted hsr, and the upper arrows indicate sequence orientation. All insertion sites show sequences joined in opposite direction. The right boxes show FISH results with splitting probes (red and blue) surrounding the hsr (green) in each cell line. FISH probes are represented as colored bars along each inserted chromosome. Target genes are in blue; arrows indicate their transcriptional orientation.
Figure 6.
Figure 6.
Evolutionary path for amplicons genesis in GLC1DM/HSR cell lines. Green lightning indicates breakage events; red dashed semicircles and curved arrows represent sequence deletions and duplications, respectively. Orange cross lines indicate homologous recombination (HR) events. Pink semicircle lines indicate the creation of new fusion junctions, labeled by appropriate SV codes. If undetermined, they are defined by a question mark. (A) The ancestral single-chromosome episomes, excised from their original location at chromosomes 1, 8 and 21, are amplified in the form of hsr(2), DM2/hsr(16) and DM3, respectively. The subsequent non-HR between chromosomes 1 and 8 episomes originated the shared hsr(8) amplicon structure, being associated with the duplication of sequences flanking the breakpoint regions on both ancestral episomes. The newly originated amplicon underwent three independent rearrangement types, indicated in (B) as enclosed in a gray dashed rectangle. Pink and pale blue squares (C, D) encompass the evolutionary paths observed in GLC1DM and GLC1HSR, respectively. (C) A single deletion event (SV A14) (B, left) generated the amplicon found at DM4. A further internal rearrangement (B, center) or alternatively its recombination with the chromosome 21 amplicon (B, right) originated the DM1 and DM5 amplicons, respectively. (D) The excision of a sub-region of 1q24.1 from the ancestral hsr(8) amplicon generated the amplified segment at hsr(3). A recombination-deletion event involving the hsr(8) and DM3 amplicons, followed by an inversion (B1) and HR, gave rise to the amplicon at hsr(8)b and hsr(1) in GLC1HSR. Finally, the subsequent excision of a sub-region encompassing 21q22.12 and 1q24 originated the hsr(4) amplicon.

References

    1. Mitelman F., Johansson B., Mertens F. 2014. Mitelman Database of Chromosome Aberrations and Gene Fusions in Cancer. http://cgap.nci.nih.gov/Chromosomes/Mitelman.
    1. Vukovic B., Beheshti B., Park P., Lim G., Bayani J., Zielenska M., Squire J.A. Correlating breakage-fusion-bridge events with the overall chromosomal instability and in vitro karyotype evolution in prostate cancer. Cytogenet. Genome Res. 2007;116:1–11. - PubMed
    1. Carroll S.M., DeRose M.L., Gaudray P., Moore C.M., Needham-Vandevanter D.R., Von Hoff D.D., Wahl G.M. Double minute chromosomes can be produced from precursors derived from a chromosomal deletion. Mol. Cell. Biol. 1988;8:1525–1533. - PMC - PubMed
    1. Storlazzi C.T., Fioretos T., Surace C., Lonoce A., Mastrorilli A., Strombeck B., D'Addabbo P., Iacovelli F., Minervini C., Aventin A., et al. MYC-containing double minutes in hematologic malignancies: evidence in favor of the episome model and exclusion of MYC as the target gene. Hum. Mol. Genet. 2006;15:933–942. - PubMed
    1. Storlazzi C.T., Lonoce A., Guastadisegni M.C., Trombetta D., D'Addabbo P., Daniele G., L'Abbate A., Macchia G., Surace C., Kok K., et al. Gene amplification as double minutes or homogeneously staining regions in solid tumors: origin and structure. Genome Res. 2010;20:1198–1206. - PMC - PubMed

Publication types