. 2014 Sep 1;74(17):4922-36.
doi: 10.1158/0008-5472.CAN-14-1022. Epub 2014 Jul 17.

Epigenetic targeting of ovarian cancer stem cells

Affiliations

Epigenetic targeting of ovarian cancer stem cells

Yinu Wang et al. Cancer Res. .

Abstract

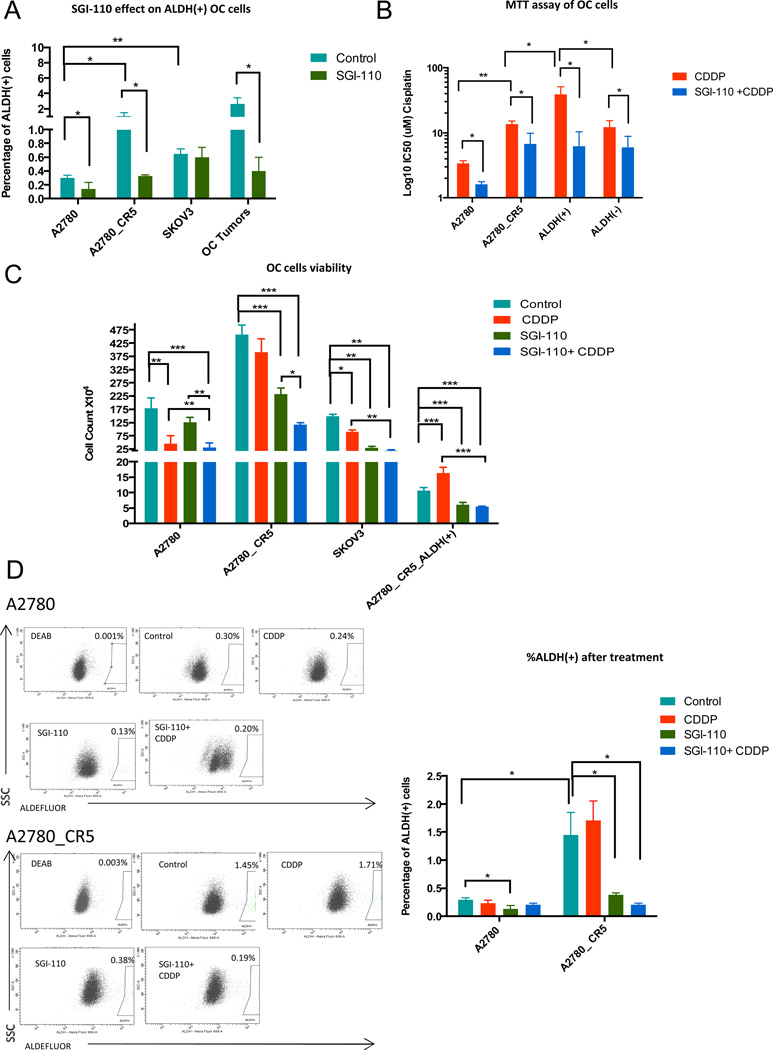
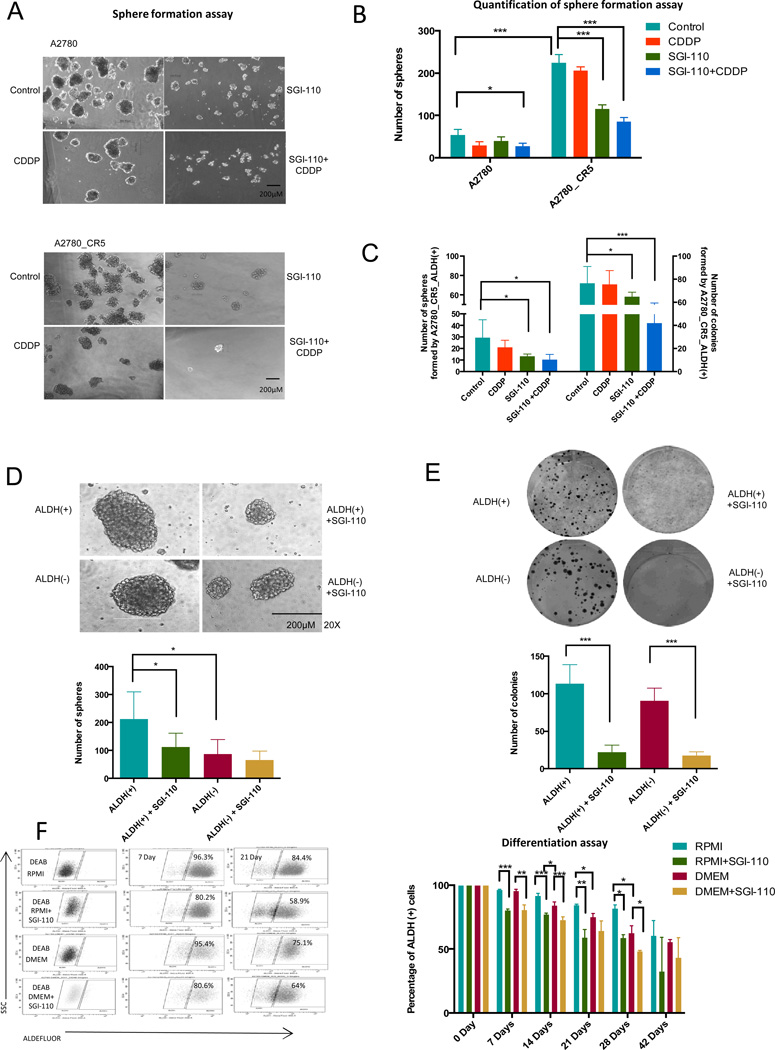
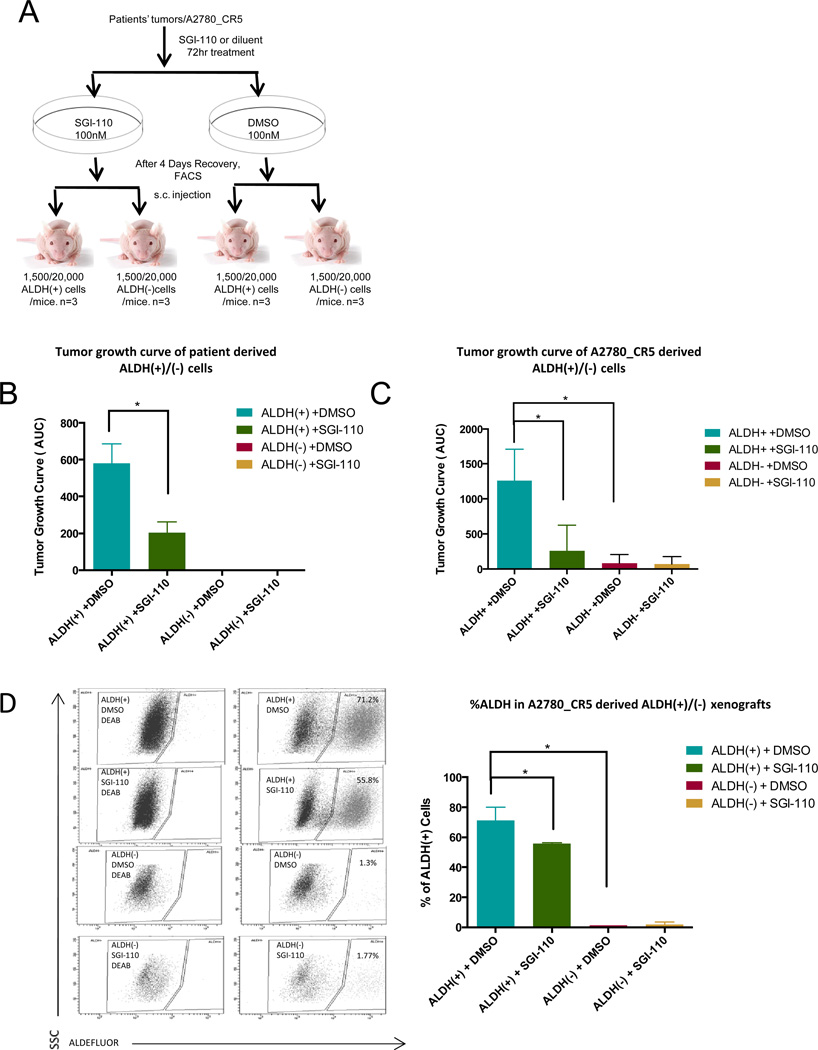
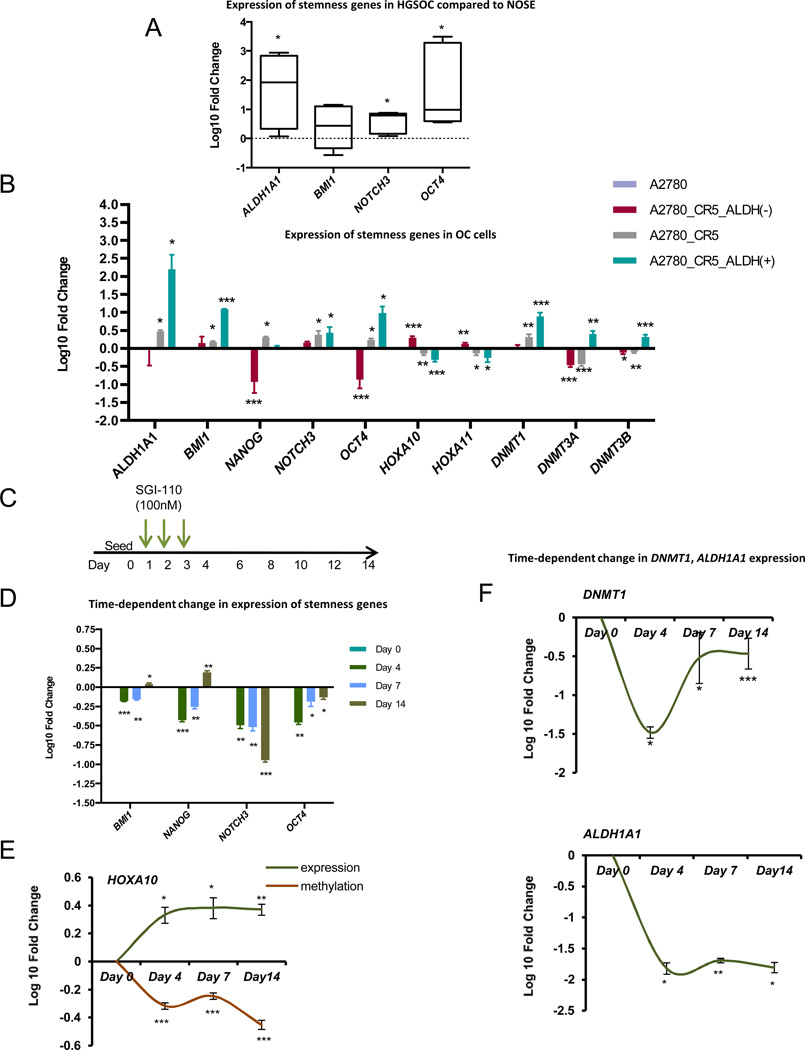
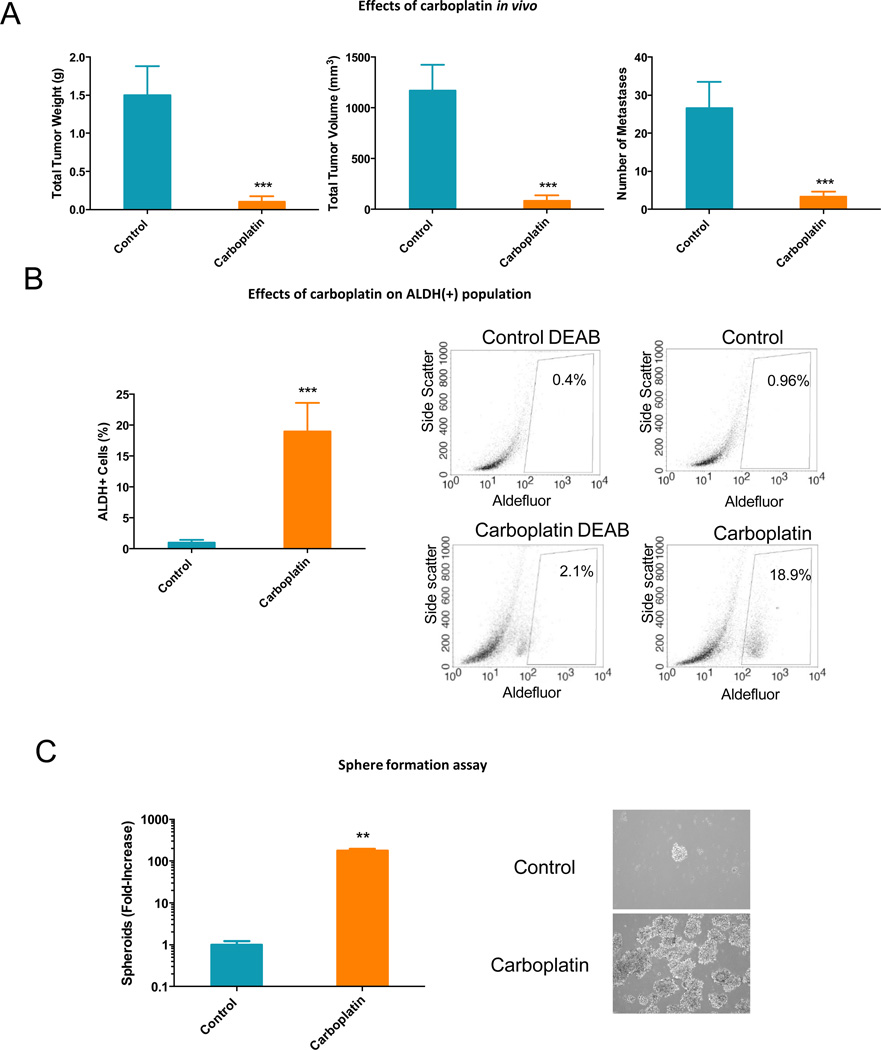
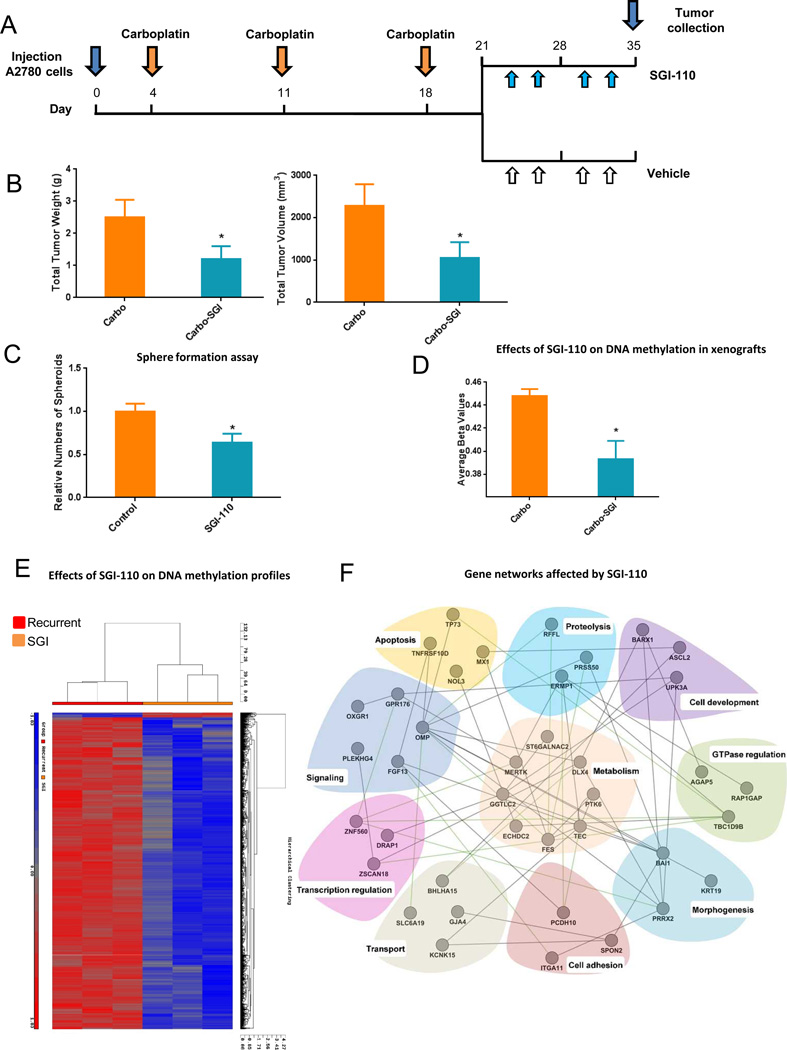
Emerging results indicate that cancer stem-like cells contribute to chemoresistance and poor clinical outcomes in many cancers, including ovarian cancer. As epigenetic regulators play a major role in the control of normal stem cell differentiation, epigenetics may offer a useful arena to develop strategies to target cancer stem-like cells. Epigenetic aberrations, especially DNA methylation, silence tumor-suppressor and differentiation-associated genes that regulate the survival of ovarian cancer stem-like cells (OCSC). In this study, we tested the hypothesis that DNA-hypomethylating agents may be able to reset OCSC toward a differentiated phenotype by evaluating the effects of the new DNA methytransferase inhibitor SGI-110 on OCSC phenotype, as defined by expression of the cancer stem-like marker aldehyde dehydrogenase (ALDH). We demonstrated that ALDH(+) ovarian cancer cells possess multiple stem cell characteristics, were highly chemoresistant, and were enriched in xenografts residual after platinum therapy. Low-dose SGI-110 reduced the stem-like properties of ALDH(+) cells, including their tumor-initiating capacity, resensitized these OCSCs to platinum, and induced reexpression of differentiation-associated genes. Maintenance treatment with SGI-110 after carboplatin inhibited OCSC growth, causing global tumor hypomethylation and decreased tumor progression. Our work offers preclinical evidence that epigenome-targeting strategies have the potential to delay tumor progression by reprogramming residual cancer stem-like cells. Furthermore, the results suggest that SGI-110 might be administered in combination with platinum to prevent the development of recurrent and chemoresistant ovarian cancer.


Conflict of interest statement

Conflict of interest:

KN and DM received research funding from Astex Pharmaceuticals Inc. and PT is employed by Astex Pharmaceuticals Inc.

Figures

Figure 1
Figure 1. Low dose SGI-110 diminishes tumor-initiating cell populations in cultured OC cells
(A) Percentage of ALDH(+) cells in untreated/or SGI-11(100nM) treated A2780 ovarian cancer cells (A2780 is the parental/platinum-sensitive and A2780_CR5 is the platinum-resistant subline), SKOV3 and three high grade serous ovarian tumors (patients 10–12). (B) IC50 of A2780 platinum-sensitive and -resistant, and A2780 platinum resistant derived ALDH(+) and ALDH(−) cells after exposure to 24h CDDP (1.67µM) alone or in combination with SGI-110 (100nM) and analyzed by MTT assay. (C) Parental A2780, A2780_CR5, SKOV3 and ALDH(+) cells isolated from A2780_CR5 were treated with SGI-110 (100nM) or CDDP (1.67µM) or the drug combination. Cell viability was measured after drug treatment using trypan blue staining. (D) Percentage of ALDH(+) in platinum-sensitive and-resistant A2780 cells: control (baseline), or after treatment with cisplatin (1.67µM), SGI-110 (100nM) or SGI-110+cisplatin. Mean values ± SD of three independent experiments in triplicate are reported (*: P<0.05, **: P<0.01, ***: P<0.001).
Figure 2
Figure 2. SGI-110 decreases self-renewal and clonogenicity of OC
(A) 30,000 dissociated sphere-forming cells derived from A2780 cells (platinum-sensitive and -resistant) were treated with CDDP (1.67µM) or SGI-110 (100nM) alone or in combination. Representative images are shown. Scale bar, 200µm. (B) Quantitative analysis of spheres formation assay. (C) 500 ALDH(+) cells derived from A2780_CR5 were treated with cisplatin (1.67µM), SGI-110 (100nM), alone or in combination, and allowed to recover for 4 days. The number of spheres (left) and colonies (right) was counted in 14 days and 7 days, respectively. (D) Sphere formation assay of 500 untreated and SGI-110 (100nM) treated ALDH(+)/ALDH(−) cells isolated from cultured A2780_CR5 (platinum-resistant). Representative images were shown in the upper panel, Scale bar, 200µm. Quantification of sphere formation assay is shown below the images. Cells were plated in triplicate and spheres were mechanically disassociated every 7 days and counted on the Day 14. (E) Colony formation assay of 500 untreated and SGI-110 (100nM) treated ALDH(+)/ALDH(−) cells isolated from cultured A2780_CR5. Cells were plated in triplicate. Colonies were stained with crystal violet and counted on day 8. (F) ALDH(+) cell differentiation assay. Average number of ALDH(+) population present in untreated or SGI-110 (100nM) treated A2780_CR5_ALDH(+) cells. ALDH(+) cells were cultured in RPMI or DMEM condition for 7, 14, 21, 28, and 42 days. Mean values ± SD of three independent experiments in triplicate are reported (*: P<0.05, **: P<0.01, ***: P<0.001).
Figure 3
Figure 3. SGI-110 decreases tumorigenesis by targeting ALDH(+) cells
(A) Schematic diagram of the approach used to study in vivo tumorigenesis of low dose SGI-110 untreated and treated ALDH(+)/(−) cells. (B) Primary xenograft tumor growth curve of 1,500 patient-derived ALDH(+) or ALDH(−) cells pretreated with SGI-110 (100nM) for 72h or DMSO in mice (n=3 for each group) during 8 weeks. Average of area under the curve (AUC) was calculated and shown in the histogram. ALDH(+)/(−) cells isolated from three high grade serous human tumors (1,500 cells per mouse). (C) Xenograft tumor growth curve of 20,000 A2780_CR5-derived ALDH(+) or ALDH(−) cells pretreated with SGI-110 (100nM) for 72h or DMSO in mice in 7 weeks (n=3 for each group). AUC was calculated and shown in the histogram. (D) Average number of ALDH(+) population present in untreated or SGI-110 (100nM) pre-treated A2780_CR5-derived ALDH(+) or ALDH(−) xenograft tumors. Mean values ± SD of three independent experiments (*: P<0.05, **: P<0.01, ***: P<0.001).
Figure 4
Figure 4. SGI-110 decreases expression of pluripotency genes and induces differentiation-associated genes in OC
(A) Average expression of stemness genes (ALDH1A1, BMI, NOTCH3, and OCT4) was measured in 5 primary high-grade serous ovarian epithelial cancers from patients compared with normal ovarian epithelial cells. (B) Average expression of stemness genes (ALDH1A1, BMI, NANOG, NOTCH3, and OCT4), DNMT isoforms (DNMT1, DNMT3A and DNMT3B) and differentiation associated genes (HOXA10 and HOXA11) were measured by qRT-PCR in A2780_CR5 (platinum-resistant), ALDH (+) and ALDH(−) cells derived from A2780_CR5 compared with parental A2780 cells. (C) Scheme of low dose SGI-110 time-course treatment. (D) Average expression of stemness genes (BMI, NANOG, NOTCH3, and OCT4) were measured by qRT-PCR in A2780_CR5-derived ALDH(+) cells on the Day 4, 7 and 14 after the initial 3 days-SGI-110 (100nM) treatment compared with untreated ALDH(+) cells. (E) Average expression of differentiation-associated gene HOXA10 mRNA measured by qRT-PCR in A2780_CR5-derived ALDH(+) cells over SGI-110 (100nM) treatment compared with untreated ALDH(+) cells. Average of DNA methylation level of HOXA10 was measured using pyrosequencing. Average expression of mRNA DNMT1 (F, upper) and ALDH1A1 (F, lower) was measured by qRT-PCR in A2780_CR5-derived ALDH(+) cells at indicated time points over SGI-110 (100nM) treatment compared with untreated ALDH(+) cells. Three independent experiments were performed and mean values ± SD are calculated (*: P<0.05, **: P<0.01, ***: P<0.001).
Figure 5
Figure 5. In vivo effects of carboplatin on xenograft growth and ovarian CSCs
(A) Effects of carboplatin on weights, volumes and metastases sites of xenograft tumors derived from A2780 cells. Bars represent average measurements +/−SD; *** P < 0.001 (n=6 per group). (B) Percentage of ALDH(+) cells in control or carboplatin-treated xenografts. Cells were isolated by mechanical and enzymatic digestion and ALDH (+) cells were detected by FACS. Bars represent average of 4 measurements +/−SD; *** P < 0.001 (left panel). Representative FACS histograms are shown in the right panels. (C) Spheroid formation by cells dissociated from control or carboplatin-treated xenografts; Bars represent average of 3 measurements +/−SD; ** P < 0.01 (left panel). Phase microscopy shows morphology of spheres formed by cells dissociated from control or carboplatin-treated xenografts (100× magnification, right panels).
Figure 6
Figure 6. In vivo effects of SGI-110 as maintenance therapy following carboplatin treatment
(A) Diagram illustrating the experimental design including the carboplatin treatment phase followed by randomization to either SGI-110 (2 mg/kg twice weekly) or diluent. (B) Effects of SGI-110 on tumor weight and volume. Bars represent average measurements +/−SD; * P < 0.05 (n=12 per group). (C) Spheroid formation by cells dissociated from control or SGI-110-treated xenografts. Bars represent average of 3 measurements +/−SD; * P < 0.05. (D) Mean β-value calculated across all CpG sited measured using Infinium 450 human methylation arrays in control and SGI-110 treated xenografts (P<0.001). (E) Hierarchical clustering displays differential DNA methylation profiles of SGI-110 or control treated xenografts (n=3 replicates) measured using Infinium 450 human methylation arrays. Columns represent individual samples and rows represent methylation sites. Each cell corresponds to the level of methylation at a specific site in a given sample. A visual dual color code is utilized with red and blue indicating high and low expression levels, respectively. The scale of color saturation, which reflects the methylation levels, is included. (F) Functional relationships between genes significantly hypomethylated by SGI-110 treatment were determined by using GeneMANIA and visualized by Cytoscape, as described.

References

    1. Bukowski RM, Ozols RF, Markman M. The management of recurrent ovarian cancer. Seminars in oncology. 2007;34:S1–S15. - PubMed
    1. Vaughan S, Coward JI, Bast RC, Berchuck A, Berek JS, Brenton JD, et al. Rethinking ovarian cancer: recommendations for improving outcomes. Nat Rev Cancer. 2011;11:719–725. - PMC - PubMed
    1. Liu CM. Cancer of the ovary. The New England journal of medicine. 2005;352:1268–1269. author reply 68–9. - PubMed
    1. Zhang S, Balch C, Chan MW, Lai HC, Matei D, Schilder JM, et al. Identification and characterization of ovarian cancer-initiating cells from primary human tumors. Cancer Res. 2008;68:4311–4320. - PMC - PubMed
    1. Jordan CT, Guzman ML, Noble M. Cancer stem cells. The New England journal of medicine. 2006;355:1253–1261. - PubMed

Publication types

MeSH terms