. 2014 Oct;24(10):1595-602.
doi: 10.1101/gr.173518.114. Epub 2014 Jul 17.

High-throughput functional testing of ENCODE segmentation predictions

Affiliations

High-throughput functional testing of ENCODE segmentation predictions

Jamie C Kwasnieski et al. Genome Res. 2014 Oct.

Abstract

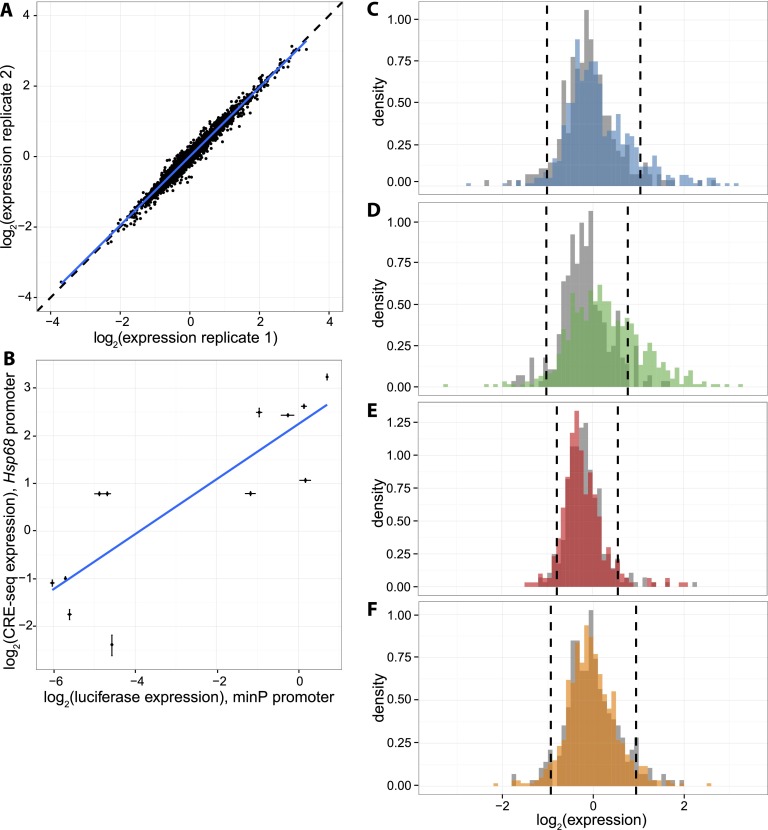
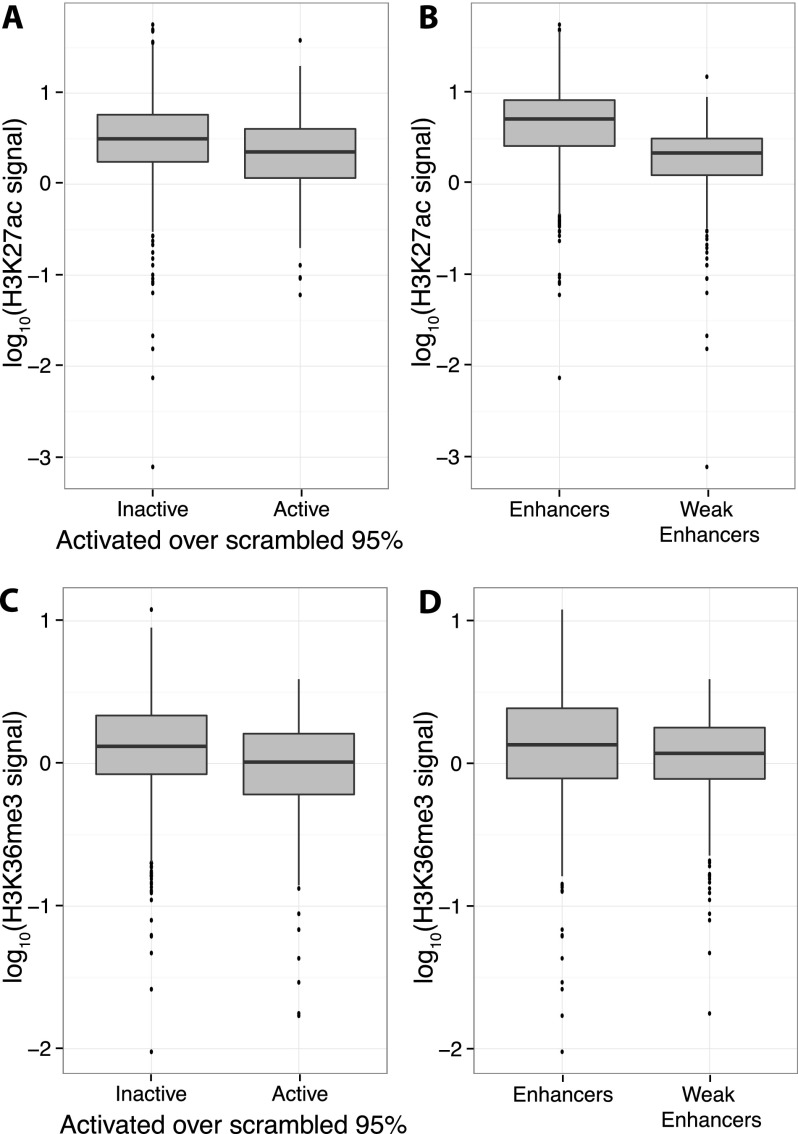
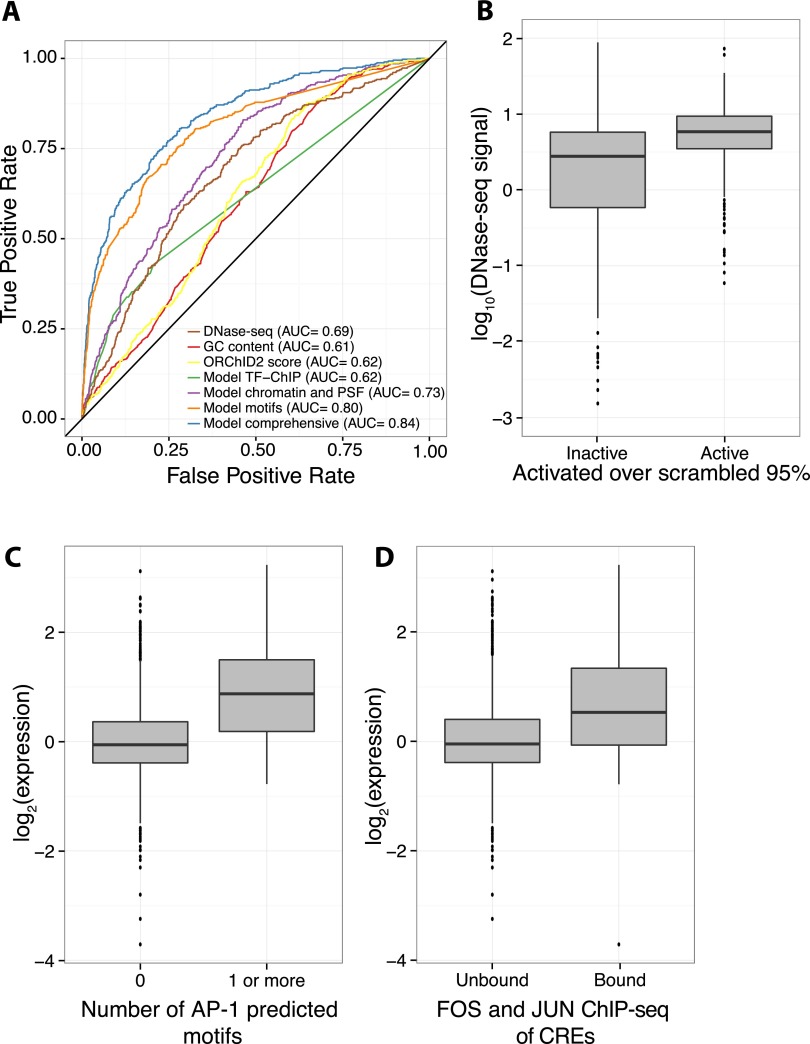
The histone modification state of genomic regions is hypothesized to reflect the regulatory activity of the underlying genomic DNA. Based on this hypothesis, the ENCODE Project Consortium measured the status of multiple histone modifications across the genome in several cell types and used these data to segment the genome into regions with different predicted regulatory activities. We measured the cis-regulatory activity of more than 2000 of these predictions in the K562 leukemia cell line. We tested genomic segments predicted to be Enhancers, Weak Enhancers, or Repressed elements in K562 cells, along with other sequences predicted to be Enhancers specific to the H1 human embryonic stem cell line (H1-hESC). Both Enhancer and Weak Enhancer sequences in K562 cells were more active than negative controls, although surprisingly, Weak Enhancer segmentations drove expression higher than did Enhancer segmentations. Lower levels of the covalent histone modifications H3K36me3 and H3K27ac, thought to mark active enhancers and transcribed gene bodies, associate with higher expression and partly explain the higher activity of Weak Enhancers over Enhancer predictions. While DNase I hypersensitivity (HS) is a good predictor of active sequences in our assay, transcription factor (TF) binding models need to be included in order to accurately identify highly expressed sequences. Overall, our results show that a significant fraction (-26%) of the ENCODE enhancer predictions have regulatory activity, suggesting that histone modification states can reflect the cis-regulatory activity of sequences in the genome, but that specific sequence preferences, such as TF-binding sites, are the causal determinants of cis-regulatory activity.


Figures

Figure 1.
Figure 1.
Reproducible expression measurements show differences in expression by segmentation class. (A) Representative scatterplot showing expression of each CRE in two biological replicates (R2 = 0.95, range of R2 between all replicates: 0.95–0.97). Dashed black line is line of equality and blue line is best fit. (B) Correlation between CRE-seq and luciferase assays. Expression driven by 12 CREs was measured in individual luciferase assay (upstream of minP promoter, x-axis) and batch CRE-seq assay (upstream of Hsp68 promoter, y-axis). Luciferase expression is normalized to the Renilla transfection control, and CRE-seq expression is normalized to the basal promoter alone. Error bars represent the standard error of the mean. Blue line is best fit. R2 = 0.70. (C–F) Histograms of genomic CRE expression measurements in K562 cells. Each class is compared to scrambled controls with equivalent GC and dinucleotide content (gray). Dashed lines are the fifth and 95th percentiles of the scrambled distributions. (C) K562 Enhancer class (blue), (D) K562 Weak Enhancer class (green), (E) K562 Repressed class (red), (F) H1-hESC Enhancer class (orange).
Figure 2.
Figure 2.
Lower H3K27ac and H3K36me3 signals are associated with higher Weak Enhancer expression. Boxplots showing that H3K27ac signal (A) and H3K36me3 signal (C) are depleted in active CREs compared to inactive CREs. H3K27ac signal (B) and H3K36me3 signal (D) are also depleted in Weak Enhancers compared to Enhancers. Active CREs are those above the 95th percentile of scrambled distribution (Table 1).
Figure 3.
Figure 3.
Chromatin features and sequence-specific binding identify active sequences. (A) Receiver operating characteristic (ROC) curve shows that a logistic regression model (“Model comprehensive”) incorporating sequence-specific binding motifs, chromatin features, primary sequence features (PSFs), and TF-ChIP data is best able to identify active sequences. Of logistic regression models with fewer features, one with sequence-specific binding motifs (“Model motifs”) does best, followed by a model incorporating chromatin and primary sequence features (“Model chromatin and PSF”), and a model with only significant TF-ChIP features (“Model TF-ChIP”). Minor groove width as predicted by ORChID2 score, GC content, and DNase I HS are also shown. Area under the curve (AUC) is indicated in legend. (B) Boxplot showing that active CREs are enriched in high DNase I HS signal over inactive CREs. (C) Boxplot showing that CREs with at least one predicted AP-1 motif drive expression higher than CREs with no AP-1 predicted motifs. (D) CREs overlapping with ChIP-seq peaks for a FOS (FOS or FOSL1) family member and a JUN (JUNB or JUND) family member, the constituent proteins of AP-1, drive expression higher than unbound CREs.

References

    1. Akaike H. 1974. A new look at the statistical model identification. IEEE Trans Automat Contr 19: 716–723
    1. Arvey A, Agius P, Noble WS, Leslie C. 2012. Sequence and chromatin determinants of cell-type-specific transcription factor binding. Genome Res 22: 1723–1734 - PMC - PubMed
    1. Bailey TL. 2011. DREME: motif discovery in transcription factor ChIP-seq data. Bioinformatics 27: 1653–1659 - PMC - PubMed
    1. Barski A, Cuddapah S, Cui K, Roh TY, Schones DE, Wang Z, Wei G, Chepelev I, Zhao K. 2007. High-resolution profiling of histone methylations in the human genome. Cell 129: 823–837 - PubMed
    1. Bishop EP, Rohs R, Parker SC, West SM, Liu P, Mann RS, Honig B, Tullius TD. 2011. A map of minor groove shape and electrostatic potential from hydroxyl radical cleavage patterns of DNA. ACS Chem Biol 6: 1314–1320 - PMC - PubMed

Publication types