. 2014 Jul 17;158(2):353-367.
doi: 10.1016/j.cell.2014.05.037.

Structural basis of hAT transposon end recognition by Hermes, an octameric DNA transposase from Musca domestica

Affiliations

Structural basis of hAT transposon end recognition by Hermes, an octameric DNA transposase from Musca domestica

Alison B Hickman et al. Cell. .

Abstract

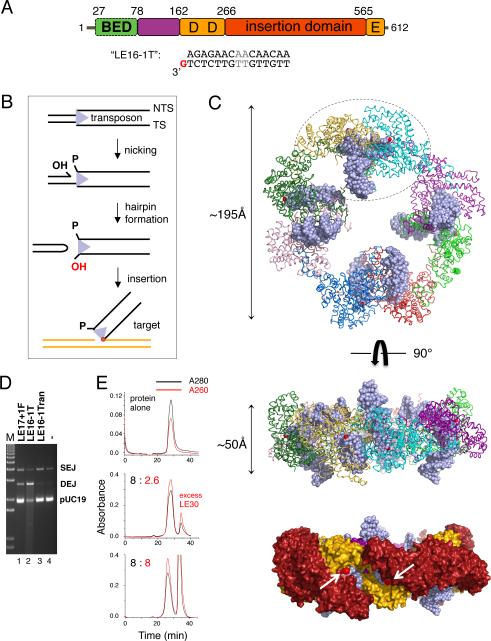
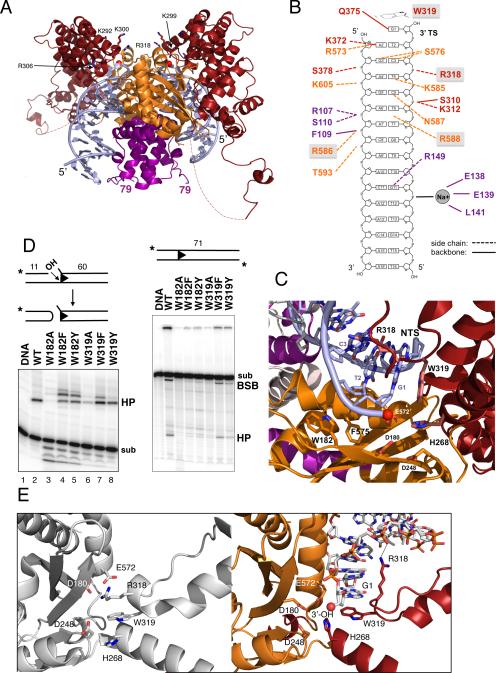
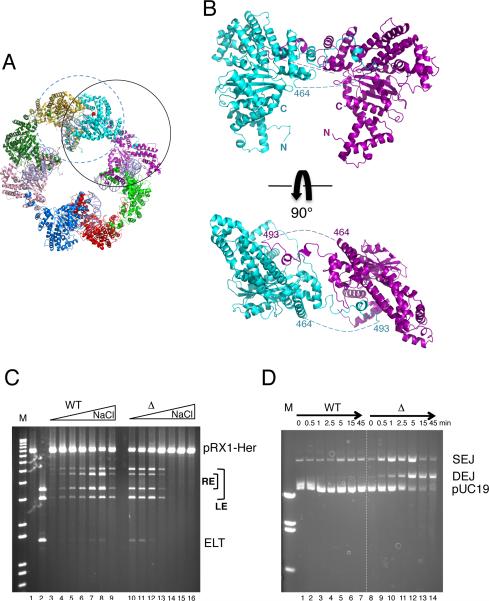
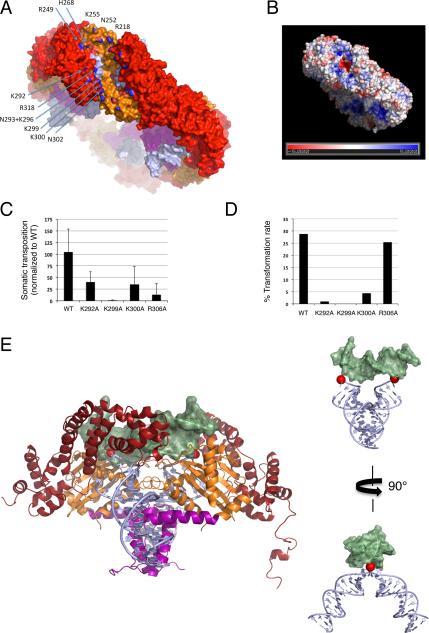
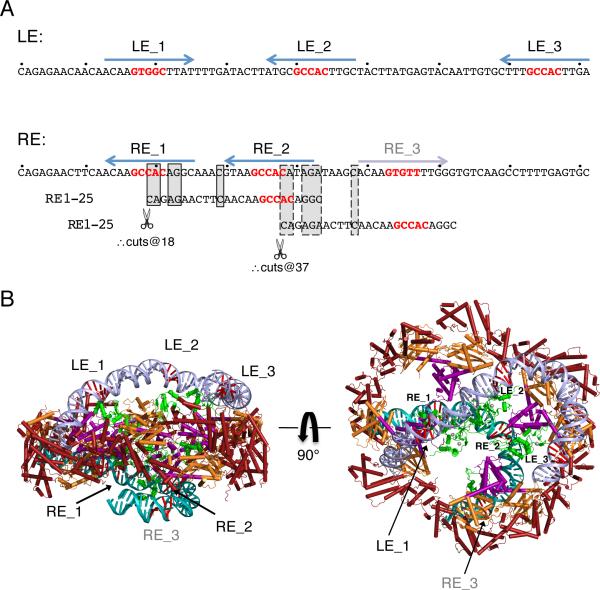
Hermes is a member of the hAT transposon superfamily that has active representatives, including McClintock's archetypal Ac mobile genetic element, in many eukaryotic species. The crystal structure of the Hermes transposase-DNA complex reveals that Hermes forms an octameric ring organized as a tetramer of dimers. Although isolated dimers are active in vitro for all the chemical steps of transposition, only octamers are active in vivo. The octamer can provide not only multiple specific DNA-binding domains to recognize repeated subterminal sequences within the transposon ends, which are important for activity, but also multiple nonspecific DNA binding surfaces for target capture. The unusual assembly explains the basis of bipartite DNA recognition at hAT transposon ends, provides a rationale for transposon end asymmetry, and suggests how the avidity provided by multiple sites of interaction could allow a transposase to locate its transposon ends amidst a sea of chromosomal DNA.


Figures

FIGURE 1
FIGURE 1. Hermes overview and structure
(A) Domain organization and “LE16-1T” DNA used for structure determination. BED domain is in green, intertwined dimerization domain in purple, RNaseH-like catalytic domain in orange, and insertion domain in red. The metal ion binding residues of the DDE motif (D180, D248, E572) are marked. Two AT bp in grey differ between the Left End (LE) and Right End (RE) 17mer terminal inverted repeats (TIRs). (B) Reaction scheme for hAT transposition. TS: transferred strand. NTS: Non-transferred strand. (C) Structure of Hermes79-612 bound to TIRs. In top and middle, each monomer is a different color, DNA is light blue, and red spheres mark the 3’-OH of each TS. In the bottom surface representation, domains are colored as in (A), and arrows point to the two 3’-OH groups (red spheres) within one dimer. (D) Strand transfer assay using pre-cleaved LE (28.6 nM) and Hermes 79-612 C519S (10 nM) at 30°C for 2 hr in standard buffer containing 150 mM NaCl. Lane 1: LE17 with one flanking 5’-phosphorylated base. Lane 2: oligonucleotide used for structural studies. Lane 3: randomized oligonucleotide of same length as LE16-1T. Lane 4: target plasmid pUC19 alone. SEJ: single-end joined products; DEJ: double-end joined products. The streak in lane 2 indicates repeated plasmid insertions, causing fragmentation. (E) Size exclusion chromatography analysis of DNA binding by full-length Hermes. Top: Hermes alone. Middle: Hermes and LE30 mixed in an 8:2.6 ratio. There is some unbound DNA, and the unsymmetric main peak suggests that both the complex and free Hermes exist under these conditions. Bottom: Hermes and LE30 mixed in an 8:8 ratio. Relative to the 8:2.6 ratio, the complex peak is unchanged in size and 280/260nm ratio, indicating that no more DNA has been bound, although the peak is more symmetrical. See also Figures S1 and S2, and Table S1.
FIGURE 2
FIGURE 2. The full-length Hermes octamer
(A) Top: SAXS experimental scattering profile (black, with uncertainty values indicated by error bars) and scattering intensities of the best-fitting model of a full-length Hermes octamer (red). Bottom: Guinier region. (B) Class-average images from negatively-stained full-length Hermes. Top left: top view average of 303 particles. Top right: side-view average of 104 particles. Bottom panels show surface renderings of a density map generated from negatively stained particles, in top and side views. Scale bars, 50Å. (C) Modeled location of eight BED domains, in green. Each BED C-terminus (red) was constrained to be close to one of the observed Hermes N-termini. See also Figure S3.
FIGURE 3
FIGURE 3. Hermes-DNA interactions
(A) View of one dimer within the octamer. Red spheres indicate the 3’-OH groups that converge in a cleft lined with basic residues, some of which are in ball-and-stick representation and labeled. Dashed lines indicate the disordered loop between residues 464 and 493. (B) Summary of protein-DNA interactions. Letter color corresponds to the domain color in Figure 1A. Boxed residues are highly conserved across the hAT superfamily. (C) Close-up of active site. (D) Effect of mutating W182 and W319 on in vitro cleavage and hairpin formation. sub: substrate; HP: hairpin; BSB: bottom strand break. BSB results from TS cleavage upon hairpin formation. (E) Active site without (left) and with (right) bound TIR. See also Figure S4.
FIGURE 4
FIGURE 4. A dimer is the catalytic unit
(A) In the octamer, the dimer where two monomers contribute to the small interface is circled in solid black, and the catalytically active dimer formed by the intertwined domain is circled in dashed blue. (B) Views of the small interface. Dashed lines indicate the disordered loops. (C) Plasmid cleavage activity of WT Hermes and HermesΔ497-516 as a function of [NaCl] (0-0.3M). Reactions were at 30°C for 60 min with 8.6 nM protein and 1 nM pRX1-Her (Figure S5). After restriction digest, bands indicate LE and RE cleavage as marked. Cleavage at both ends results in an Excised Linear Transposon (ELT). Lanes 3,10: 0.1 mM NaCl. Lanes 4,11: 50 mM. Lanes 5,12: 100 mM. Lanes 6,13: 150 mM. Lanes 7,14: 200 mM. Lanes 8,15: 250 mM. Lanes 9,16: 300 mM. (D) LE30 strand transfer activity of WT Hermes and HermesΔ497-516 as a function of time at 23°C in buffer containing 10 nM protein, 22.9 nM LE30, and 50 mM NaCl. See also Figures S5 and S6.
FIGURE 5
FIGURE 5. Target binding
(A) Surface representation of the octamer rim and selected residues lining the cleft; only those of one monomer are labelled (N atoms are colored blue). (B) Electrostatic potential calculated using APBS (Baker et al., 2001) with only one dimer complexed with DNA and two active site Mn2+ at 150 mM salt. (C) Effect of single point mutations on somatic transposition frequency in D. melanogaster embryos (Table S2). Error bars represent standard deviation in Hermes transposition frequency (corrected for a piggyBac internal control) for three replicate injections. (D) Effect of single point mutations on germline transformation rate in D. melanogaster calculated by dividing the number of transgenics by the number of fertile crosses (Table S3). (E) Left: Hermes dimer docked to target DNA (light green) of the PFV intasome, PDB ID 3SO1. Right: Model of the DNAs alone with Hermes TIRs in light blue and PFV target DNA in green. Red spheres are the TS 3’-OH groups. See also Tables S2 and S3.
FIGURE 6
FIGURE 6. Subterminal repeats within Hermes ends are recognized by the BED domain
(A) Alignment of subterminal repeats containing 5’-GTGGC (black) where numbering is the distance in bp from the tip of either LE or RE. “RC” indicates that the repeat is in the opposite orientation relative to LE_1. Hermes contains no other 5’-GTGGC repeats. An eighth repeat “RE_3” (grey) was inferred from in vitro transposition reactions. (B) Effect of mutating LE_1 or RE_1 on plasmid cleavage as a function of protein concentration. For each set, [protein] are 9.5 nM, 47 nM, and 95 nM. (C) Effect on plasmid cleavage of shifting LE_1 sequence (boxed) relative to the transposon tip. (D) Time course of strand transfer upon mutating LE_1 or RE_1, and as a function of deleting the BED domain. For the first four sets, time points are 0, 0.5, 1, 2.5, 5, 15, and 45 min at 25°C in buffer containing 15 nM protein, 28.6 nM ends, and 200 mM NaCl; for the fifth set, comparison of LE30 strand transfer activity by WT Hermes to that of Hermes79-612, time points are 0, 1, 7, and 45 min. (E) Electromobility shift assay with Drosophila-expressed Hermes and a LE30 probe. Lane 1: probe alone. Lane 2: EGFP control nuclear extract. Lane 3: Hermes nuclear extract. Lanes 4, 5: Hermes nuclear extract with the indicated excess of LE30 specific competitor. (F) Results of EMSA competition assay with single base mutant probes. Dark bars indicate 20X competitor levels and lighter bars indicate 200X levels. E1 is the nonspecific competitor at 200X. If the mutation had no effect, values similar to that for the specific competitor (Spec) are expected. The double-headed arrow indicates the region of strongest interaction, which includes the 5’-GTGGC repeat (boxed). See also Figure S7 and Table S4.
FIGURE 7
FIGURE 7. Hermes/DNA recognition beyond the TIRs
(A) Arrangment of subterminal repeats within NTS of LE 1-81 and RE 1-81, where 5’-GTGGC of each repeat is in red. Below the RE sequence are two alignments with RE bp 1-25 (common bases are boxed with solid lines for the alignment of RE_2 with RE_1 and dashed lines for the alignment of RE_3 with RE_1). Transposition assay results suggest that Hermes can mistake RE_2 and RE_3 for RE_1, resulting in aberrant cleavage. (B) Modeled Hermes binding to its transposon ends. The structure of the first 16 bp of each end are those in the observed crystal structure. On LE (light blue), modeled DNA from bp 17-81 is bent to bring LE_2 and LE_3 close to the presumed locations of the BED domains (green; PDB ID 2CT5). RE (turquoise) bp 17-66 are modeled using 50 bp of nucleosomal DNA (PDB ID 1AOI). 5’-GTGGC of each subterminal repeat is in red. The modeled BED domains have been allowed to move within the ring relative to the model in Figure 2C. It is not clear how LE_4 and RE_4 might be bound. See also Table S5.

Similar articles

Cited by

References

    1. Aravind L. The BED finger, a novel DNA-binding domain in chromatin-boundary-element-binding proteins and transposases. Trends Biochem. Sci. 2000;25:421–423. - PubMed
    1. Arensburger P, et al. Phylogenetic and functional characterization of the hAT transposon superfamily. Genet. 2011;188:45–57. - PMC - PubMed
    1. Aziz RK, Breitbart M, Edwards RA. Transposases are the most abundant, most ubiquitous genes in nature. Nucl. Acids Res. 2010;38:4207–4217. - PMC - PubMed
    1. Baker NA, Sept D, Joseph S, Holst MJ, McCammon JA. Electrostatics of nanosystems: Application to microtubules and the ribosome. Proc. Natl. Acad. Sci. USA. 2001;98:10037–10041. - PMC - PubMed
    1. Becker H-A, Kunze R. Maize Activator transposase has a bipartite DNA binding domain that recognizes subterminal sequences and the terminal inverted repeats. Mol. Gen. Genet. 1997;254:219–230. - PubMed

Publication types

Associated data