. 2014 Jul 17;158(2):422-433.
doi: 10.1016/j.cell.2014.05.041.

Cheese rind communities provide tractable systems for in situ and in vitro studies of microbial diversity

Affiliations

Cheese rind communities provide tractable systems for in situ and in vitro studies of microbial diversity

Benjamin E Wolfe et al. Cell. .

Abstract

Tractable microbial communities are needed to bridge the gap between observations of patterns of microbial diversity and mechanisms that can explain these patterns. We developed cheese rinds as model microbial communities by characterizing in situ patterns of diversity and by developing an in vitro system for community reconstruction. Sequencing of 137 different rind communities across 10 countries revealed 24 widely distributed and culturable genera of bacteria and fungi as dominant community members. Reproducible community types formed independent of geographic location of production. Intensive temporal sampling demonstrated that assembly of these communities is highly reproducible. Patterns of community composition and succession observed in situ can be recapitulated in a simple in vitro system. Widespread positive and negative interactions were identified between bacterial and fungal community members. Cheese rind microbial communities represent an experimentally tractable system for defining mechanisms that influence microbial community assembly and function.


Figures

Figure 1
Figure 1. Microbial communities form on the surfaces of naturally aged cheeses
Cross-sections through naturally aged cheeses show rind biofilms growing on the surface of the cheese curd. (A) A bloomy rind biofilm, (B) a natural rind biofilm, and (C) a washed rind biofilm. See also Figure S1.
Figure 2
Figure 2. Distribution of abundant genera across cheese rind communities
Each column represents averaged data for multiple wheels of an individual cheese. Top panel shows bacterial (16S rDNA) data and bottom panel shows fungal (internal transcribed spacer or ITS) data. Columns show relative abundance of genera within each cheese. Communities were clustered using a UPGMA tree and asterisks indicate clusters that were supported with >70% jackknife support. Only those genera that had an average abundance of 1% or greater across all samples are indicated; genera less than 1% abundance are combined and shown in black. See also Figure S2, Table S1, and Table S2.
Figure 3
Figure 3. Abiotic and biotic drivers of rind community composition
(A) A combined dataset of 16S rDNA and ITS amplicons was processed in QIIME, and Bray-Curtis dissimilarity was used to generate a principal coordinate analysis of rind microbial communities. Each green, orange, or blue circle represents averaged community composition data for each natural, washed, or bloomy rind cheese sampled. Separation of rind communities is driven by genera that are specifically enriched in each of the three rind types (Table S2B). (B) Bloomy, natural and washed rind cheeses have different surface environments. Bars represent mean (+/−SEM). A double asterisk indicates significant differences (P<0.005) in an ANOVA. NS = not significant (P>0.05). (C) Plots of PC1 versus three environmental variables show that moisture is significantly correlated with rind type. (D) Taxonomic groups show different responses to gradients in moisture across cheese rinds. A plot of Pearson’s r depicts significant (P<0.05, with false discovery rate correction) negative and positive correlations between abundance of particular genera and % moisture. (E) Spearman rank correlations of OTUs highlight non-random associations between bacterial and fungal genera. Significant (P<0.05, adjusted for multiple comparisons using Holm’s method) positive and negative associations are indicated with a bold boundary. (F) Fungal and bacterial richness are positively correlated across cheese rind communities. Each dot represents mean fungal and bacterial richness per cheese. See also Figure S3, Table S1, and Table S3.
Figure 4
Figure 4. Functional diversity of cheese rind microbial communities
(A) Procrustes analysis shows similar clustering of samples (M2=0.391) using either taxonomic (amplicon) or functional (whole genome shotgun sequencing) data from 22 rind metagenomes. Plots of principal coordinate one versus environmental data (smaller ordination plots) reveal significant relationships between functional composition and both moisture (r2=0.29, P<0.01) and pH (r2=0.41, P<0.001). (B) Relative abundance of 56 KEGG pathways identified by LEfSe as significantly enriched in bloomy, natural, or washed rind cheeses. Plotted are those pathways that were >1% abundance across the entire dataset. Each column represents a pathway and plotted is the relative distribution of that pathway across the three different rind types. (C) Maximum likelihood phylogeny of amino acid sequences of methionine gamma-lyase (MGL), methionine-alpha-deamino-gamma-mercaptomethane-lyase (MGMML), cysteine gamma-lyase (CGL), cysteine beta-lyase (CBL), and cysteine gamma-synthase from prokaryotic and eukaryotic organisms. Colored dots indicate habitats where organisms are found. Node labels indicate bootstrap support; only those with >60% support are shown. Three novel MGL sequences with high similarity to the marine bacterium Pseudoalteromonas haloplanktis, were recovered from three cheese metagenomes (highlighted in grey box). See also Figure S4 and Table S4.
Figure 5
Figure 5. Reconstruction of divergent rind communities in vitro
(A) Principal coordinates analysis of replicate in vitro communities demonstrates that rind microbial communities diverge in composition when exposed to abiotic manipulations (PERMANOVA pseudo-F=19.23, P<0.0001). The bloomy treatment (addition of 50 times more Galactomyces CFUs to initial inoculum) did not significantly alter community composition compared to control communities (P=0.20). (B) Relative abundance of the fungal (top) and bacterial (bottom) taxa in the initial inoculum added to all treatments and at the time of harvest for control, bloomy, natural, and washed rind treatments. (C) CFUs of fungi (top) and bacteria (bottom) of the final communities. A double asterisk indicates significant differences (P<0.005) based on Tukey’s honestly significant difference test. Bars represent mean (+/−SEM). See also Figure S5 and Table S5.
Figure 6
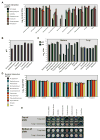
Figure 6. Bacterial-fungal interactions among cheese rind microbial species
(A) Bacterial responses to co-culture with one of 6 fungal species. Red asterisks indicate a statistically significant (Dunnett’s test, P<0.05) decrease in abundance in the two-species co-culture treatment relative to growth alone (black bars). Green asterisks indicate statistically significant (P<0.05) increase in abundance in the two-species co-culture treatment relative to growth alone (black bars). Bars represent mean (+/−SEM). (B) pH of the cheese curd medium when different fungal species were grown. The pH of the medium in all fungal treatments was significantly higher compared to the uninoculated control (Dunnett’s test, P<0.0001). (C) Response of bacterial and fungal species grown alone on cheese curd agar at pH 5 and pH7. Bars represent mean (+/−SEM). (D) Fungal responses to co-culture with one of 11 bacterial species. Asterisk colors correspond to same system used in (A). (E) Photograph of select wells of pair-wise interaction assay. Wells with fungi grown alone and fungi grown with the bacterium Arthrobacter are shown. Panels on the top show top-down views of the 96-well plate where the surface of the microbial biofilm can be seen. Bottom panel shows the underside of each well for the corresponding top-down views showing how pigment production can easily be observed. See also Figure S6 and Table S6.
Figure 7
Figure 7. Succession within a natural rind community is highly reproducible
(A and B) Reproducible succession in an in situ rind community was observed as three batches of a natural rind cheese aged (1–63 days). (A) Relative abundance of community members was determined by amplicon sequencing of bacterial 16S rDNA (top panel) and the fungal ITS region (bottom panel). Each column represents the average of three wheels from the same batch. (B) The combined dataset of 16S rDNA and ITS amplicons was processed in QIIME, and Bray-Curtis dissimilarity was used to generate a principal coordinates analysis of rind microbial communities. Principal coordinate 1 was plotted versus time. Each point represents the average of triplicate wheels +/− standard deviation. (C and D) Reproducible succession was observed as in vitro natural rind communities aged (0–63 days). Colony forming units (CFUs) of each species were determined by plating serial dilutions of homogenized in vitro cheeses in triplicate at each timepoint. (C) CFUs were used to determine the relative abundance of bacterial (top panel) and fungal (bottom panel) community members. (D) Growth curves were plotted for each community member. Each point represents the average of triplicates, +/− standard deviation. See also Figure S7 and Table S7.

References

    1. Akey JM, Ruhe AL, Akey DT, Wong AK, Connelly CF, Madeoy J, Nicholas TJ, Neff MW. Tracking footprints of artificial selection in the dog genome. Proc Natl Acad Sci. 2010;107:1160–1165. - PMC - PubMed
    1. Amarita F, Yvon M, Nardi M, Chambellon E, Delettre J, Bonnarme P. Identification and functional analysis of the gene encoding methionine-γ-lyase in Brevibacterium linens. Appl Environ Microbiol. 2004;70:7348–7354. - PMC - PubMed
    1. Beresford TP, Fitzsimons NA, Brennan NL, Cogan TM. Recent advances in cheese microbiology. Int Dairy J. 2001;11:259–274.
    1. Bokulich NA, Mills DA. House microbiome drives microbial landscapes of artisan cheesemaking plants. Appl Environ Microbiol. 2013;79:5214–5223. - PMC - PubMed
    1. Bokulich NA, Thorngate JH, Richardson PM, Mills DA. Microbial biogeography of wine grapes is conditioned by cultivar, vintage, and climate. Proc Natl Acad Sci U S A. 2014;111:E139–48. - PMC - PubMed

Publication types