. 2014 Aug;124(8):3489-500.
doi: 10.1172/JCI71981. Epub 2014 Jul 18.

Autophagy defends pancreatic β cells from human islet amyloid polypeptide-induced toxicity

Autophagy defends pancreatic β cells from human islet amyloid polypeptide-induced toxicity

Jacqueline F Rivera et al. J Clin Invest. 2014 Aug.

Abstract

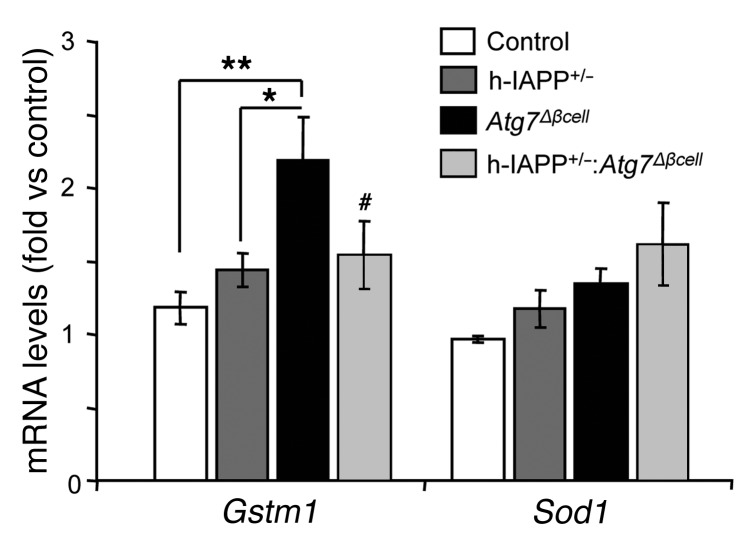
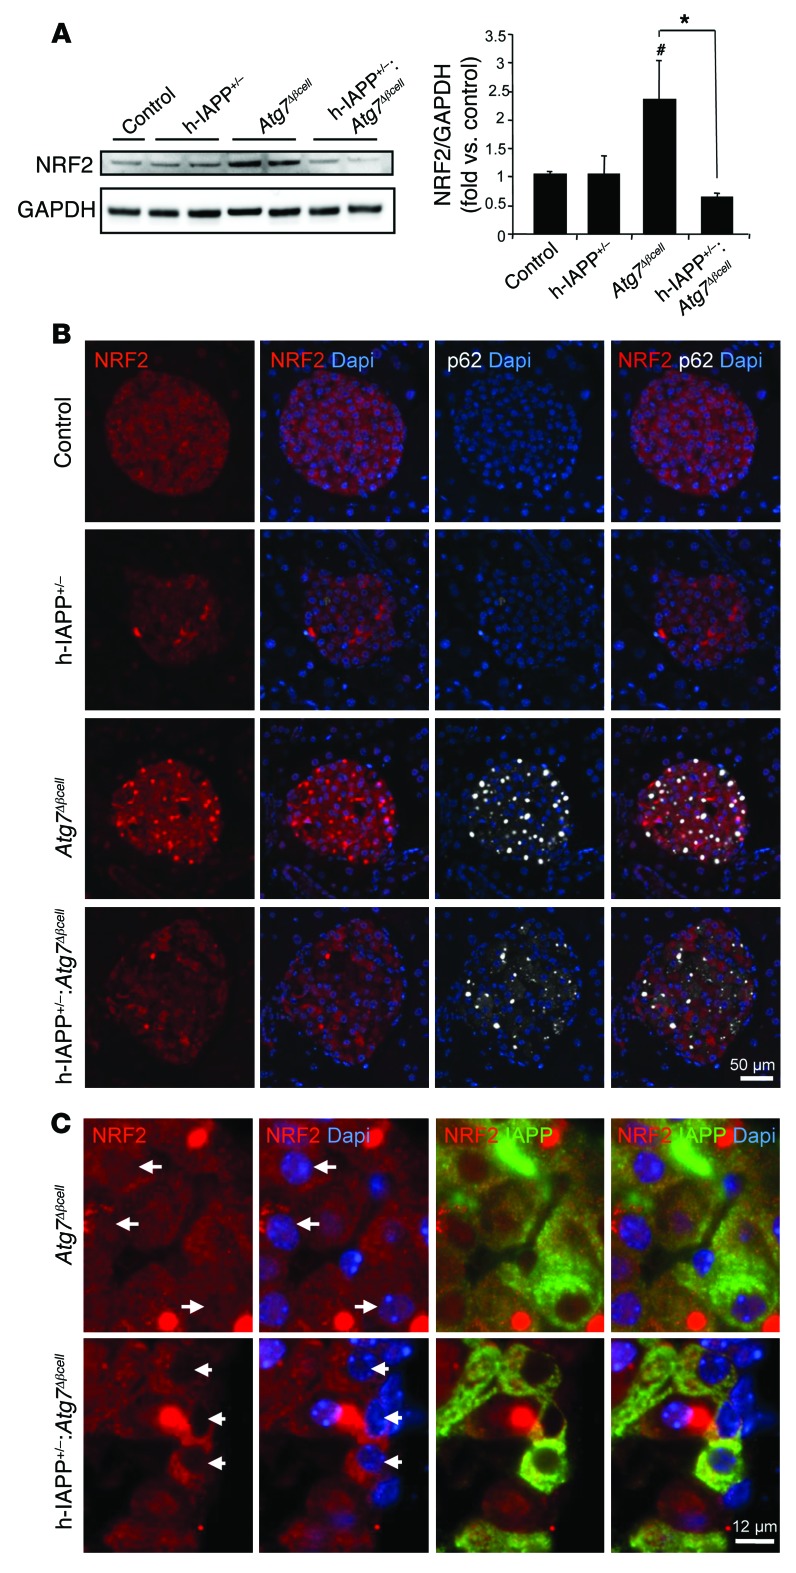
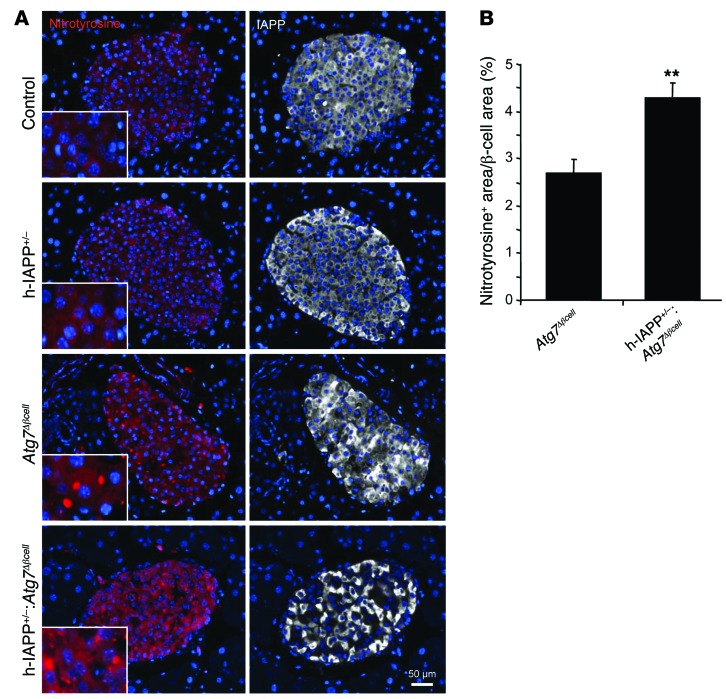
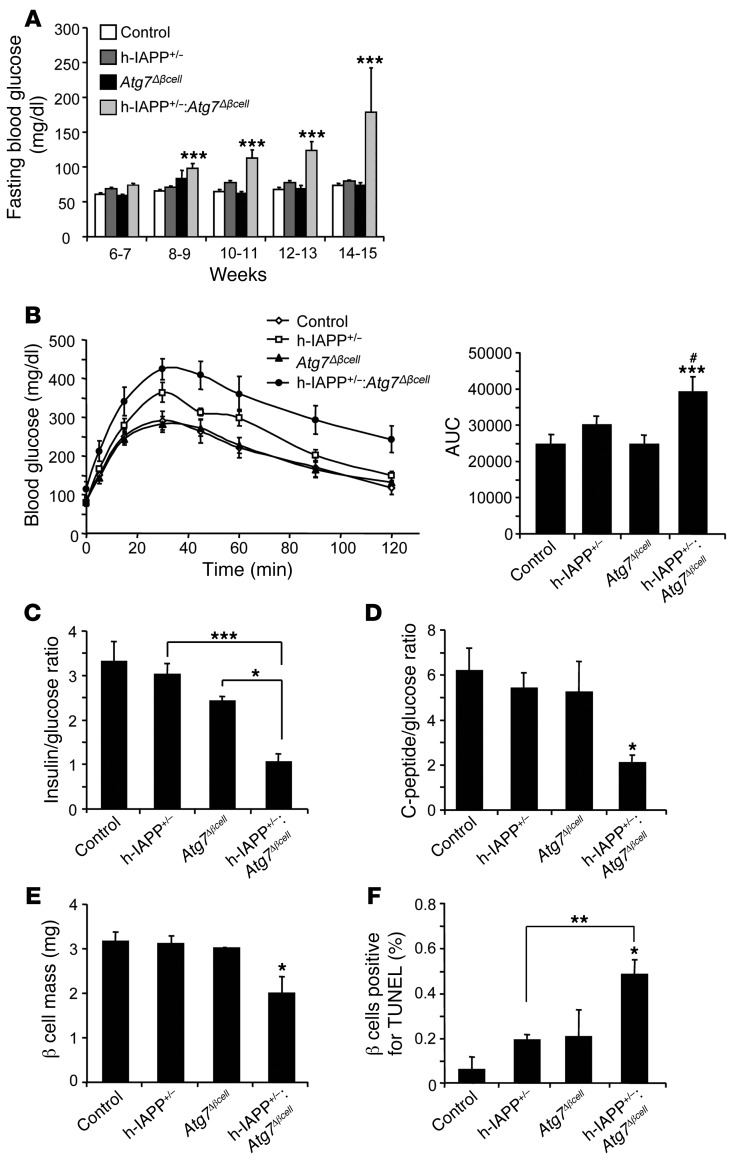
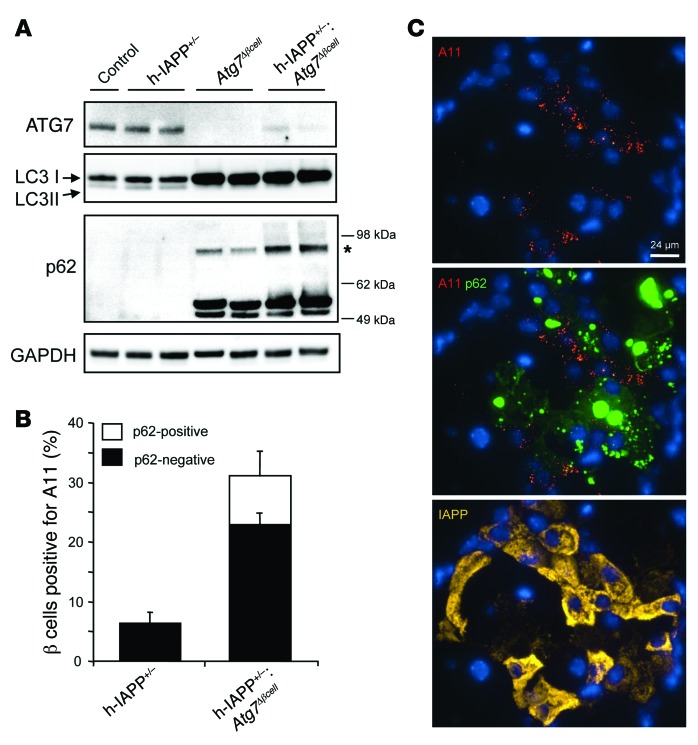
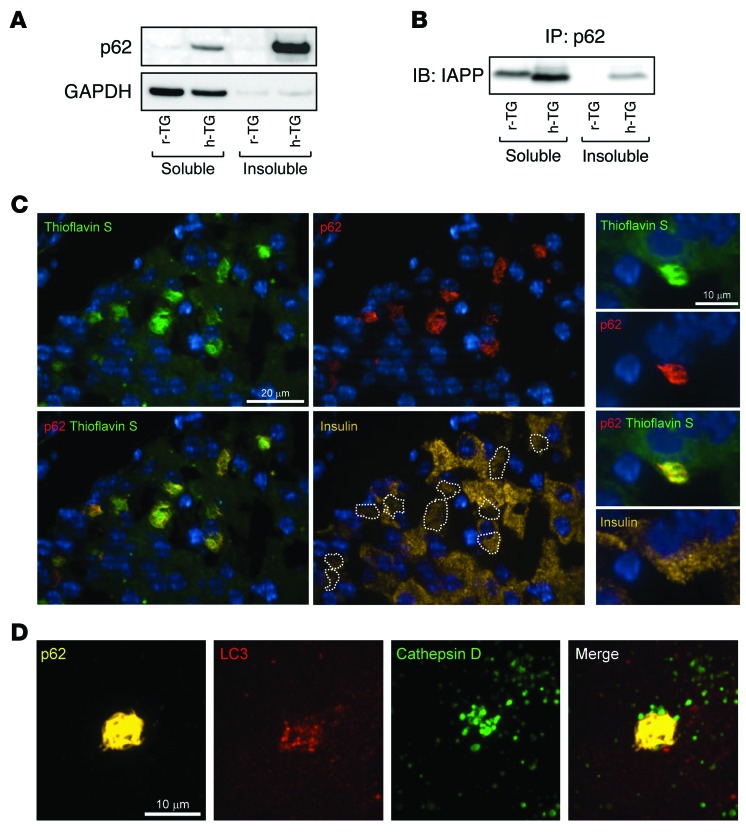
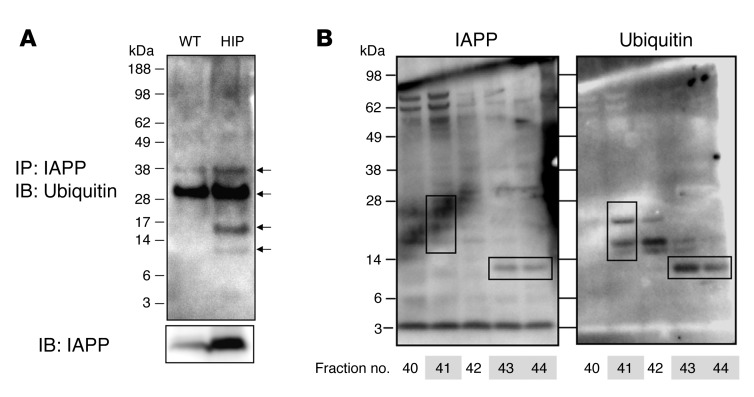
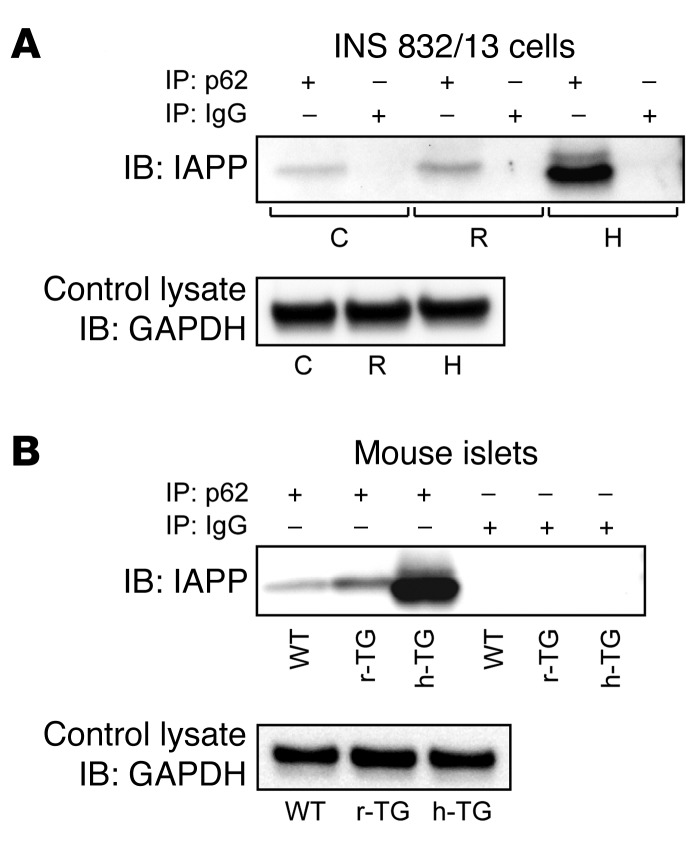
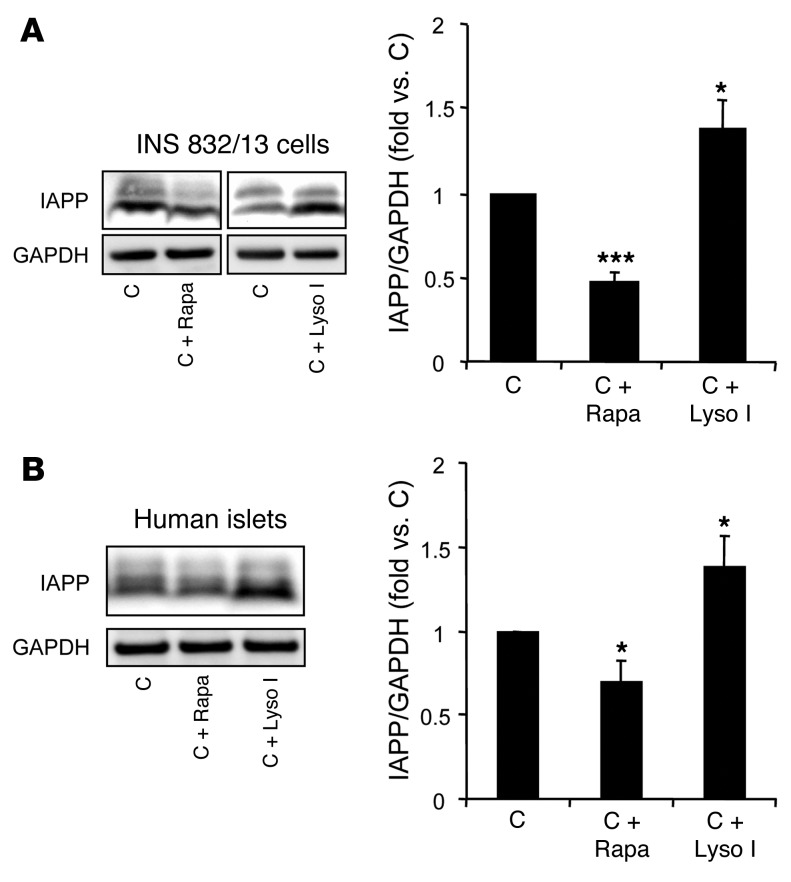
Type 2 diabetes (T2D) is characterized by a deficiency in β cell mass, increased β cell apoptosis, and extracellular accumulation of islet amyloid derived from islet amyloid polypeptide (IAPP), which β cells coexpress with insulin. IAPP expression is increased in the context of insulin resistance, the major risk factor for developing T2D. Human IAPP is potentially toxic, especially as membrane-permeant oligomers, which have been observed to accumulate within β cells of patients with T2D and rodents expressing human IAPP. Here, we determined that β cell IAPP content is regulated by autophagy through p62-dependent lysosomal degradation. Induction of high levels of human IAPP in mouse β cells resulted in accumulation of this amyloidogenic protein as relatively inert fibrils within cytosolic p62-positive inclusions, which temporarily averts formation of toxic oligomers. Mice hemizygous for transgenic expression of human IAPP did not develop diabetes; however, loss of β cell-specific autophagy in these animals induced diabetes, which was attributable to accumulation of toxic human IAPP oligomers and loss of β cell mass. In human IAPP-expressing mice that lack β cell autophagy, increased oxidative damage and loss of an antioxidant-protective pathway appeared to contribute to increased β cell apoptosis. These findings indicate that autophagy/lysosomal degradation defends β cells against proteotoxicity induced by oligomerization-prone human IAPP.


Figures

Figure 9
Figure 9. mRNA levels of the antioxidant genes Gstm1 and Sod1 in islets from hemizygous h-IAPP transgenic mice deficient in autophagy.
Levels of Gstm1 and Sod1 mRNA were evaluated by RT-qPCR in islets isolated from control (9 weeks, n = 4), h-IAPP+/– (9 weeks, n = 3), Atg7Δβcell (9 weeks, n = 3), and h-IAPP+/–:Atg7Δβcell (9 weeks, n = 3) mice. Cyclophilin was used as housekeeping gene. Data are expressed as mean ± SEM; *P < 0.05; **P < 0.01; #P < 0.05, versus Atg7Δβcell mice.
Figure 8
Figure 8. Antioxidant NRF2 is reduced in hemizygous h-IAPP transgenic mice deficient in autophagy.
(A) Protein levels of NRF2 were assessed by Western blot using islet lysates obtained from control (9 weeks, n = 3), h-IAPP+/– (9 weeks, n = 3), Atg7Δβcell (9 weeks, n = 3), and h-IAPP+/–:Atg7Δβcell mice (9 weeks, n = 3). GAPDH was used as loading control. The graph represents the quantification of NRF2 protein levels. Data are expressed as mean ± SEM; *P < 0.05; #P < 0.05, versus control and h-IAPP+/– mice. (B) NRF2 and p62 levels were assessed by immunofluorescence in pancreatic sections from control, h-IAPP+/–, Atg7Δβcell, and h-IAPP+/–:Atg7Δβcell mice (NRF2, red; p62, white; nuclei, blue). Scale bar: 50 μm. (C) Images of islets from Atg7Δβcell and h-IAPP+/–:Atg7Δβcell mice showing cytosolic and nuclear staining of NRF2 (NRF2, red; IAPP, green; nuclei, blue). Arrows indicate nuclei. Scale bar: 12 μm.
Figure 7
Figure 7. Deficiency in autophagy increases the oxidative damage in β cells of hemizygous h-IAPP transgenic mice.
(A) Nitrotyrosine levels were assessed by immunofluorescence in pancreatic tissue from control, h-IAPP+/–, Atg7Δβcell, and h-IAPP+/–:Atg7Δβcell mice (nitrotyrosine, red; IAPP, white; nuclei, blue). The insets show higher magnification. (B) Quantification of the fractional area of β cell positive for nitrotyrosine (signal above background) in Atg7Δβcell (15 weeks, n = 3) and h-IAPP+/–:Atg7Δβcell mice (12 ± 1 weeks, n = 3) (expressed in percentage). 10–17 islets per section were analyzed. Data are expressed as mean ± SEM; **P < 0.01. Scale bar: 50 μm.
Figure 6
Figure 6. Deficiency in autophagy induces diabetes, impaired β cell function, loss of β cell mass, and increased β cell apoptosis in hemizygous h-IAPP transgenic mice.
(A) Fasting blood glucose in control, h-IAPP+/–, Atg7Δβcell, and h-IAPP+/–:Atg7Δβcell mice. The number of mice per group of a given age is provided in Supplemental Table 1. ***P < 0.001. (B) IPGTT performed by intraperitoneal injection of 2 g/kg glucose in control and h-IAPP+/–:Atg7Δβcell mice (both 8 weeks, n = 6) and h-IAPP+/– and Atg7Δβcell mice (both 8 weeks, n = 7). The graph represents area under the curve (AUC). #P < 0.05, versus h-IAPP+/– mice; ***P < 0.001, versus Atg7Δβcell mice. (C) Plasma insulin/glucose ratio and (D) C-peptide/glucose ratio in control (14 ± 1 weeks, n = 8), h-IAPP+/– (14 ± 1 weeks, n = 8), Atg7Δβcell (15 weeks, n = 4), and h-IAPP+/–:Atg7Δβcell (12 ± 1 weeks, n = 6) mice. *P < 0.05, versus Atg7Δβcell and h-IAPP+/– mice for C-peptide/glucose ratio; ***P < 0.001. (E) β Cell mass in the 4 groups of mice at given mean age: control (14 ± 1 weeks, n = 4), h-IAPP+/– (14 ± 1 weeks, n = 4), Atg7Δβcell (15 weeks, n = 3), and h-IAPP+/–:Atg7Δβcell mice (12 ± 1 weeks, n = 6). *P < 0.05, versus all groups. (F) β Cell apoptosis (TUNEL) in the 4 groups of mice at given mean age: control (13 ± 1 weeks, n = 3), h-IAPP+/– (13 ± 2 weeks, n = 3), Atg7Δβcell (15 weeks, n = 3), and h-IAPP+/–:Atg7Δβcell (12 ± 1 weeks, n = 3) mice. *P < 0.05, versus Atg7Δβcell mice; **P < 0.01, versus h-IAPP+/– mice. Data are expressed as mean ± SEM.
Figure 5
Figure 5. h-IAPP toxic oligomers accumulate in β cells of hemizygous h-IAPP transgenic mice deficient in autophagy.
(A) Protein levels of ATG7, LC3, and p62 were assessed by Western blot using islet protein lysates obtained from Atg7Δβcell (9 weeks, n = 3) mice and control, h-IAPP+/–, and h-IAPP+/–:Atg7Δβcell (all 9 weeks, n = 4) mice. GAPDH was used as loading control. The asterisk indicates tightly aggregated p62. (B) Quantification of the percentage of β cells positive for cytosolic A11 labeling in h-IAPP+/–:Atg7Δβcell and h-IAPP+/– mice. Included are the percentages of β cells positive (white) or negative (black) for p62 among A11-positive β cells. Data are expressed as mean ± SEM. (C) Confocal images of a representative islet from a h-IAPP+/–:Atg7Δβcell mouse pancreatic section stained with anti-oligomer antibody A11 (oligomers, red; p62, green; IAPP, yellow; nuclei, blue). Scale bar: 24 μm.
Figure 4
Figure 4. Insoluble p62-sequestered IAPP is targeted for lysosomal degradation.
(A) Islets were isolated from 9- to 10-week-old r-TG and h-TG mice. Islet lysates were used to separate total cellular protein into soluble and insoluble fractions. Levels of p62 and IAPP were assessed by Western blot. GAPDH was used as control. A representative image from 4 independent experiments is shown. (B) Soluble and insoluble fractions from mouse islets were subjected to immunoprecipitation with anti-p62 antibody. Immunoprecipitated proteins were resolved by SDS-PAGE and immunoblotted with anti-IAPP antibody. (C) Thioflavine S staining in pancreatic sections from 9- to 10-week-old h-TG mice (Thioflavin S, green; p62, red; insulin, yellow; nuclei, blue) (scale bar: 20 μm). A higher magnification of an inclusion is presented on the right (scale bar: 10 μm). The dotted outlines on the insulin panel indicate the position of thioflavin S– and p62-positive inclusions. (D) Fluorescent confocal images of p62-positive inclusion using (p62, yellow; LC3, red; cathepsin D, green) in pancreatic tissue from h-TG mice (original magnification, ×63). Scale bar: 10 μm.
Figure 3
Figure 3. IAPP is ubiquitinated.
(A) Islets were isolated from 4- to 6-month-old WT and HIP rats. Islet lysates were subjected to immunoprecipitation with a rabbit anti-IAPP antibody. Immunoprecipitated proteins were resolved by SDS-PAGE and immunoblotted with a mouse anti-ubiquitin antibody. Levels of IAPP are shown as control. Arrows indicate polyubiquitinated IAPP (n = 3). (B) Islets were isolated from 4- to 6-month-old HIP rats. Insoluble fraction was obtained by a detergent extraction protocol and dissolved in 6 M guanidine plus 0.5 M DTT for 1 hour at 37°C. Fractions were collected by HPLC and then immunoblotted with a rabbit anti-IAPP antibody. The membrane was then stripped and immunoblotted with a mouse anti-ubiquitin antibody. A representative blot from 2 independent experiments is shown. Boxes indicate bands detected by both anti-IAPP and anti-ubiquitin antibodies.
Figure 2
Figure 2. IAPP interacts with p62 in β cells.
(A) INS 832/13 cells were transduced at 400 MOI for 36 hours with r-IAPP (R) or h-IAPP (H) adenoviruses. Cell lysates were subjected to immunoprecipitation (IP) with anti-p62 antibody or IgG as control. Immunoprecipitated proteins were resolved by SDS-PAGE and immunoblotted (IB) with anti-IAPP antibody. Levels of GAPDH are shown as internal and loading control. A representative image from 5 independent experiments is shown. C, nontransduced cells (B) Islets were isolated from 9- to 10-week-old WT, r-IAPP (r-TG), and homozygous h-IAPP transgenic (h-TG) mice. Islet lysates were subjected to immunoprecipitation with anti-p62 antibody or IgG as control. Immunoprecipitated proteins were resolved by SDS-PAGE and immunoblotted with anti-IAPP antibody. Levels of GAPDH are shown as internal and loading control. A representative image from 3 independent experiments is shown.
Figure 1
Figure 1. Intracellular IAPP levels are modulated by regulators of autophagy.
(A) INS 832/13 cells were treated with rapamycin (Rapa, 10 nM) for 40 hours, lysosomal inhibitors (Lyso I) (E-64-d, 10 μg/ml and pepstatin A, 10 μg/ml) for 24 hours, or left untreated (C). Levels of IAPP were assessed by Western blot. GAPDH was used as loading control. The graph represents the quantification of the processed/mature form of IAPP (n = 4). (B) Human islets were treated with rapamycin (10 nM) for 30 hours, lysosomal inhibitors (E-64-d, 10 μg/ml and pepstatin A, 10 μg/ml) for 30 hours, or left untreated. Levels of IAPP were assessed by Western blot. GAPDH was used as loading control. The graph represents the quantification of IAPP protein levels (n = 3). Data are expressed as mean ± SEM; *P < 0.05; ***P < 0.001.

Comment in

References

    1. Butler AE, Janson J, Bonner-Weir S, Ritzel R, Rizza RA, Butler PC. β-Cell deficit and increased β-cell apoptosis in humans with type 2 diabetes. Diabetes. 2003;52(1):102–110. doi: 10.2337/diabetes.52.1.102. - DOI - PubMed
    1. Haataja L, Gurlo T, Huang CJ, Butler PC. Islet amyloid in type 2 diabetes, and the toxic oligomer hypothesis. Endocr Rev. 2008;29(3):303–316. doi: 10.1210/er.2007-0037. - DOI - PMC - PubMed
    1. Gurlo T, et al. Evidence for proteotoxicity in β cells in type 2 diabetes: toxic islet amyloid polypeptide oligomers form intracellularly in the secretory pathway. Am J Pathol. 2010;176(2):861–869. doi: 10.2353/ajpath.2010.090532. - DOI - PMC - PubMed
    1. Butler AE, Jang J, Gurlo T, Carty MD, Soeller WC, Butler PC. Diabetes due to a progressive defect in β-cell mass in rats transgenic for human islet amyloid polypeptide (HIP rat) — a new model for type 2 diabetes. Diabetes. 2004;53(6):1509–1516. doi: 10.2337/diabetes.53.6.1509. - DOI - PubMed
    1. Hoppener JWM, et al. Extensive islet amyloid formation is induced by development of type II diabetes mellitus and contributes to its progression: pathogenesis of diabetes in a mouse model. Diabetologia. 1999;42(4):427–434. doi: 10.1007/s001250051175. - DOI - PubMed

Publication types

MeSH terms