. 2014 Jul 18;9(7):e102678.
doi: 10.1371/journal.pone.0102678. eCollection 2014.

Identifying and quantifying heterogeneity in high content analysis: application of heterogeneity indices to drug discovery

Affiliations

Identifying and quantifying heterogeneity in high content analysis: application of heterogeneity indices to drug discovery

Albert H Gough et al. PLoS One. .

Erratum in

Abstract

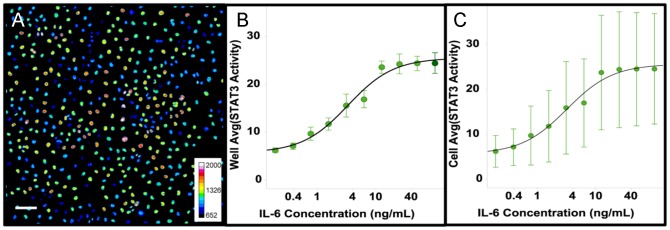
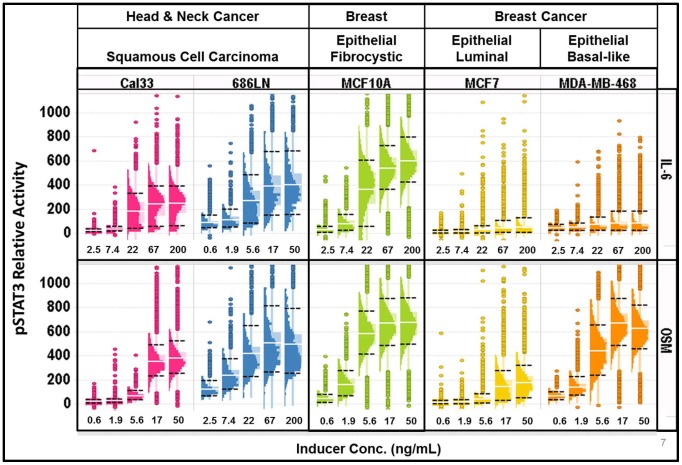
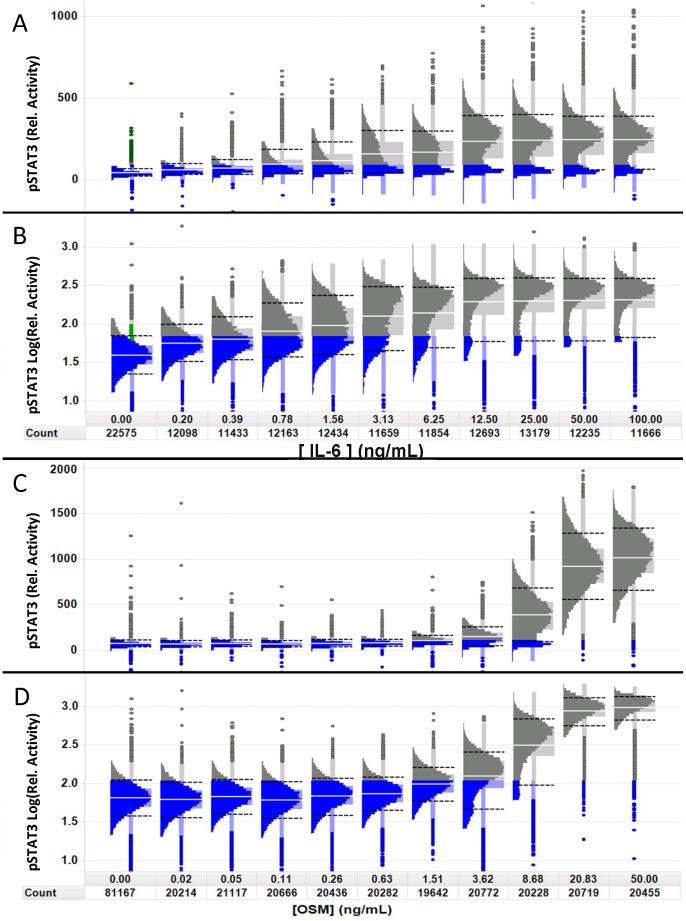
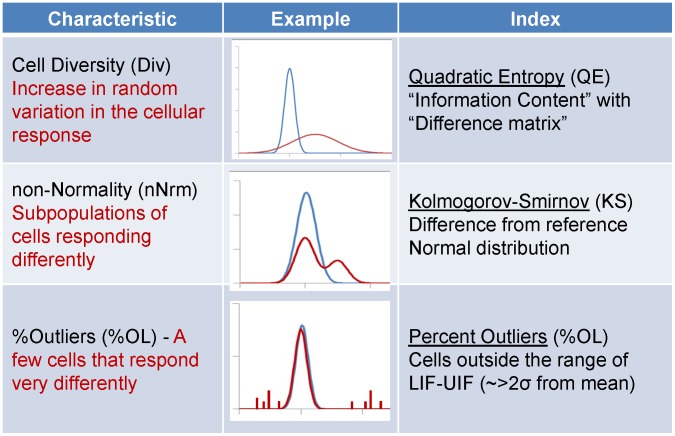
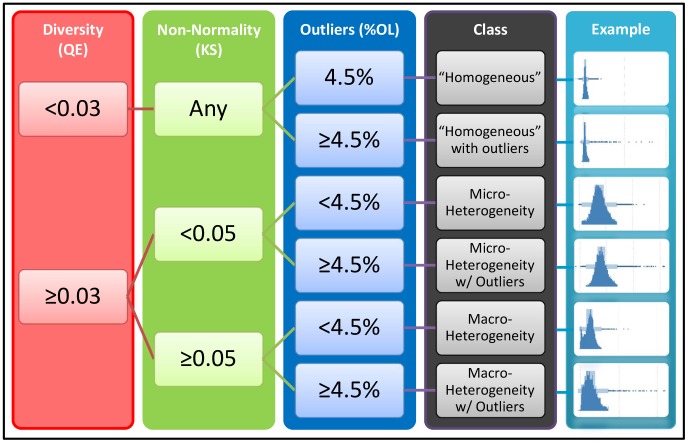
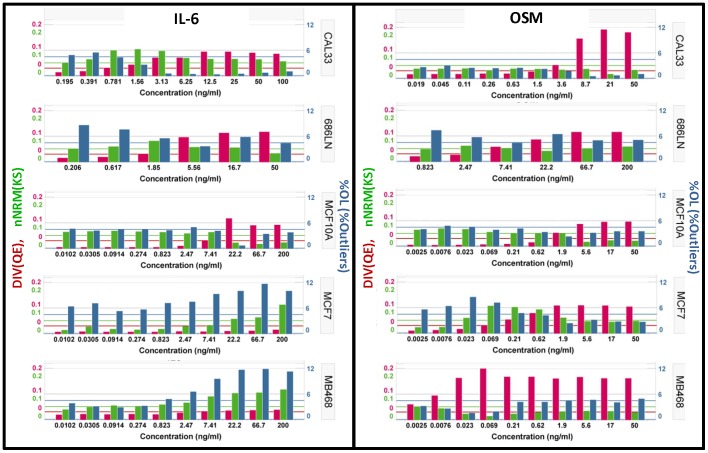
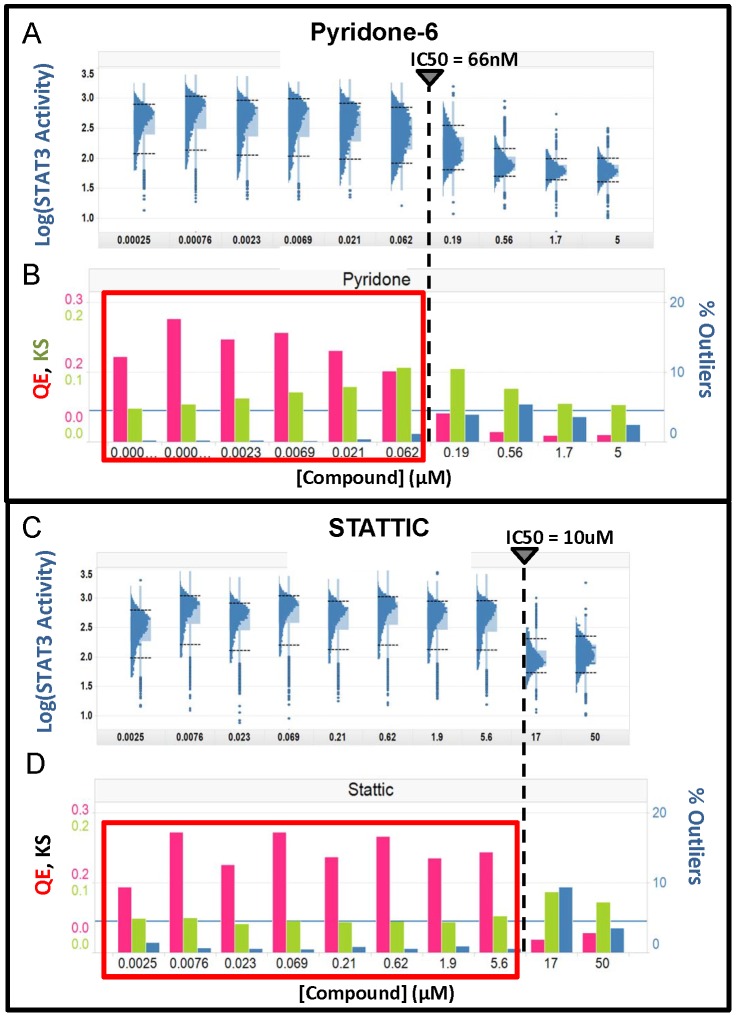
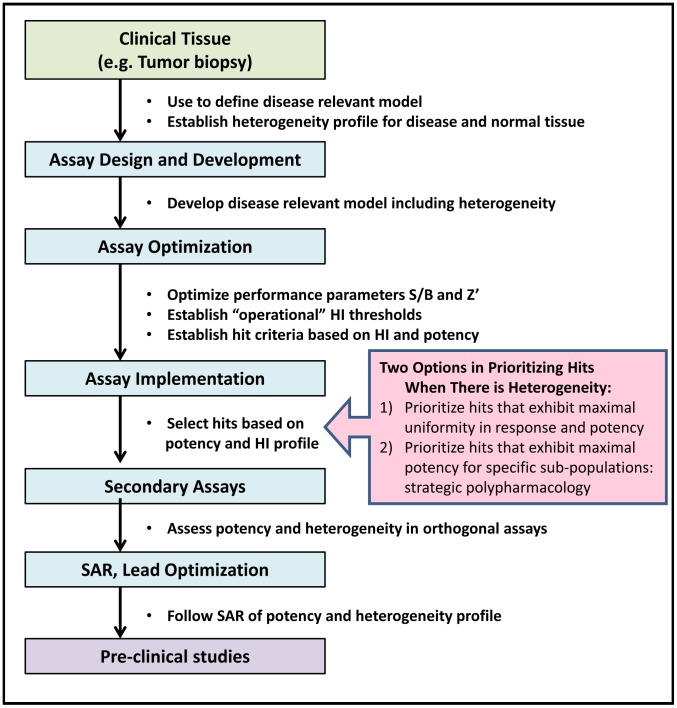
One of the greatest challenges in biomedical research, drug discovery and diagnostics is understanding how seemingly identical cells can respond differently to perturbagens including drugs for disease treatment. Although heterogeneity has become an accepted characteristic of a population of cells, in drug discovery it is not routinely evaluated or reported. The standard practice for cell-based, high content assays has been to assume a normal distribution and to report a well-to-well average value with a standard deviation. To address this important issue we sought to define a method that could be readily implemented to identify, quantify and characterize heterogeneity in cellular and small organism assays to guide decisions during drug discovery and experimental cell/tissue profiling. Our study revealed that heterogeneity can be effectively identified and quantified with three indices that indicate diversity, non-normality and percent outliers. The indices were evaluated using the induction and inhibition of STAT3 activation in five cell lines where the systems response including sample preparation and instrument performance were well characterized and controlled. These heterogeneity indices provide a standardized method that can easily be integrated into small and large scale screening or profiling projects to guide interpretation of the biology, as well as the development of therapeutics and diagnostics. Understanding the heterogeneity in the response to perturbagens will become a critical factor in designing strategies for the development of therapeutics including targeted polypharmacology.


Conflict of interest statement

Competing Interests: The authors have declared that no competing interests exist.

Figures

Figure 1
Figure 1. Heterogeneity in the activation STAT3 in Cal33 cells.
Cal33 cells were treated with IL-6 (50 ng/ml) for 15 min. then fixed and labeled with an antibody to phospho-STAT3-Y705. A) Pseudocolor image of STAT3 activation shows a high degree of heterogeneity in the intensity of the Cy5-labeled secondary antibody (color scale at lower right indicates mapping of relative fluorescent intensities to colors). Scale bar is 100 um (lower left). B) The standard deviation of the well average STAT3 activity in replicate wells (EC50 = 3.3 ng/ml, error bars are ±1σ, N = 8) indicates the assay is highly reproducible despite the observed cellular heterogeneity (Z’ = 0.54) C) The standard deviation of the cellular STAT3 activity (error bars are ±1σ) indicates the high variability in the cell-to-cell STAT3 Activity consistent with the appearance of the image (A).
Figure 2
Figure 2. Variation in the cellular distributions of STAT3 activation by IL-6 and OSM in several cell types.
Top series) Histo-box plots of the activation of STAT3 by IL-6 after 15 min exposure to IL-6 at the indicated concentrations in 2 HNSCC cell lines, 1 breast cell line and 2 breast cancer cell lines. Bottom series) The activation of STAT3 by OSM was measured at 15 min. in the same 5 cell lines as above. Note: 686LN cells were found to be much more sensitive to IL-6 and much less sensitive to OSM than the other cell lines, so the concentrations were adjusted appropriately.
Figure 3
Figure 3. Visual analysis of phenotypic heterogeneity using the histo-box plot.
Population distributions of STAT3 activity in Cal33 cells at the peak induction time of 15th percentile of the untreated cells (left most histogram) are colored in blue to highlight the apparently non-responsive subpopulations. “Count” indicates the total number of cells measured. A) Linear-scaled dose-response distributions of STAT3 activity at the indicated concentrations of IL-6 show a persistent subpopulation of cells with a distribution comparable to the unstimulated cells. The well average EC50 = 3.3 ng/ml. B) Log-scaling of the same distributions in A shows that the CV of the responding cells (far right) is similar to the unstimulated cells (far left). C) Linear-scaled population distributions of STAT3 activation by OSM at the indicated concentrations also show a non-responding subpopulation at 8.68 ng/ml, but unlike IL-6 there are only a few outliers that are apparently non-responsive at 50 ng/ml and the responding cells appear to be more normally distributed. D) Log-scaling of the same distributions in C shows that the CV of the responding cells (far right) is similar to the unstimulated cells (far left).
Figure 4
Figure 4. Three indices for characterizing cellular heterogeneity.
Three indices that provide information about the distribution were chosen. Cell Diversity (DIV) characterizes the overall heterogeneity in the population without regard for the specific shape of the distribution, using the Quadratic Entropy, a metric that is sensitive to the spread of the distribution as well as the magnitude of the differences between phenotypes in the distribution. Non-Normality (nNRM) indicates deviation from a normal distribution, distinguishing between micro- and macro-heterogeneity. %Outliers (%OL) indicates the fraction of cells that respond differently than the majority.
Figure 5
Figure 5. Decision tree for interpreting the Heterogeneity Indices.
Using thresholds established for each index, DIV, nNRM and %OL, a binary decision tree can be used to characterize heterogeneity in a given sample. The thresholds for DIV (0.03) and nNRM (0.05) were selected as the mean +3 SD for each index in replicate negative control wells for Cal33 cells. The threshold for %OL (4.5%) is the percent outliers expected for a normal distribution.
Figure 6
Figure 6. Comparison of the activation of STAT3 across 5 cell lines.
Application of the HI's to the data in Figure 2. Left Panel) Activation of pSTAT3 by exposure to IL-6 for 15 min at the indicated concentrations. Right Panel) Activation of pSTAT3 by exposure to Oncostatin M for 15 min at the indicated concentrations. Red Bars) Diversity index (DIV) indicating the relative heterogeneity associated with the activation of pSTAT3. The horizontal red line indicates the selected threshold for classifying populations a heterogeneous. Green Bars) The non-Normality index (nNRM) indicating the extent of deviation from a single, normally distributed population. The green horizontal line indicates the selected threshold for classifying a population as having macro-heterogeneity. Blue Bars) The percent outliers (%OL) indicates the percentage of cells with an activity level that is above the upper inner fence or below the lower inner fence. The horizontal blue line indicates the selected threshold that is used to classify a population as having more than the expected number of outliers.
Figure 7
Figure 7. Heterogeneity in the response to inhibitors of STAT3 activation.
Cal33 cells were exposed to Pyridone-6 (A&B) or STATTIC (C&D) at the indicated concentrations for 3 hours prior to stimulation with 50 ng/ml of IL-6. A) Inhibition by Pyridone-6. Log scaled distributions are plotted to normalize CV. B) Three heterogeneity parameters were calculated from the linear scaled data, DIV (red), nNRM (green) and %OL (blue). C) Log scaled distributions of inhibition by Stattic. D) The same three heterogeneity parameters are plotted for the linear scaled distributions of Stattic inhibition. The vertical dashed lines indicate the IC50 for the compounds calculated from the well-averaged signal intensities.
Figure 8
Figure 8. Heterogeneity analysis applied throughout the early drug discovery process.
Heterogeneity analysis is required to guide decisions throughout the drug discovery process, beginning with defining disease relevant biology in clinical samples, and establishing benchmarks for subsequent analyses. Next disease relevant models, which by necessity will be heterogeneous, are developed and optimized. Heterogeneity is characterized in the models, and thresholds for HI's are established along with potency criteria to select hits. Screening hits are advanced to secondary assays based on their potency and HI profile. Heterogeneity of response to compounds will be model dependent, and assessing heterogeneity in orthogonal secondary assays will provide insights into understanding the MOA. Monitoring the heterogeneity profile during SAR and lead optimization is essential to keeping lead development on target and mechanism of the disease relevant biology.

References

    1. Li RX, Zeng R (2009) Dynamic proteomics for investigating the response of individual cancer cells under drug action. Expert Rev Proteomics 6: 19–21. - PubMed
    1. Greaves M, Maley CC (2012) Clonal evolution in cancer. Nature 481: 306–313. - PMC - PubMed
    1. Almendro V, Marusyk A, Polyak K (2013) Cellular Heterogeneity and Molecular Evolution in Cancer. Annual Review of Pathology: Mechanisms of Disease 8: 277–302. - PubMed
    1. Meacham CE, Morrison SJ (2013) Tumour heterogeneity and cancer cell plasticity. Nature 501: 328–337. - PMC - PubMed
    1. Junttila MR, de Sauvage FJ (2013) Influence of tumour micro-environment heterogeneity on therapeutic response. Nature 501: 346–354. - PubMed

Publication types

Substances