

Characterizing accuracy and precision of glucose sensors and meters
- PMID: 25037194
- PMCID: PMC4455380
- DOI: 10.1177/1932296814541810
Characterizing accuracy and precision of glucose sensors and meters
Abstract
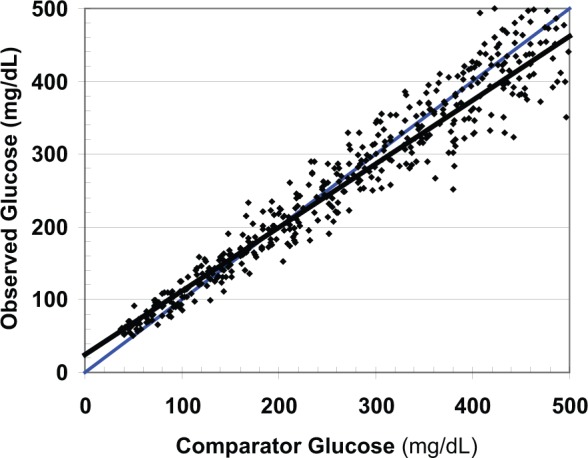
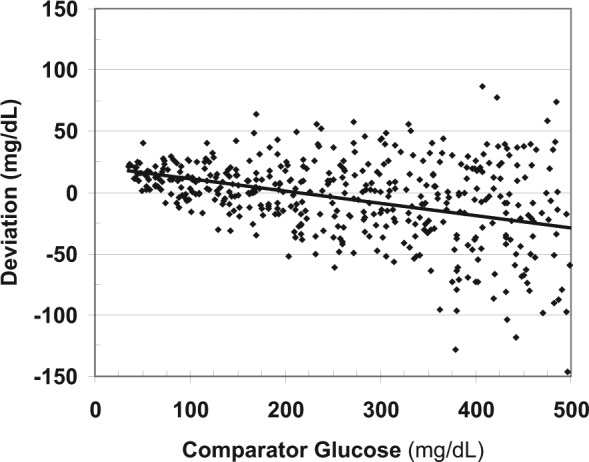
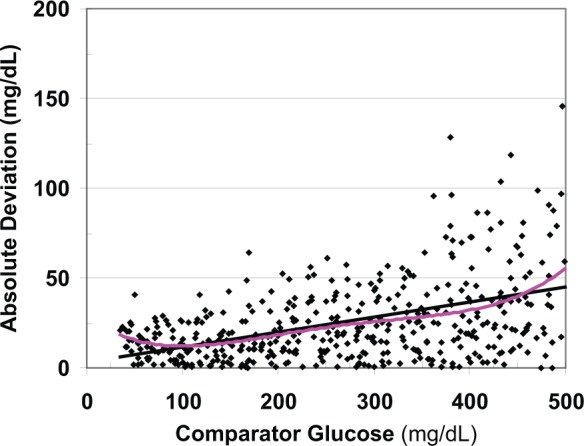
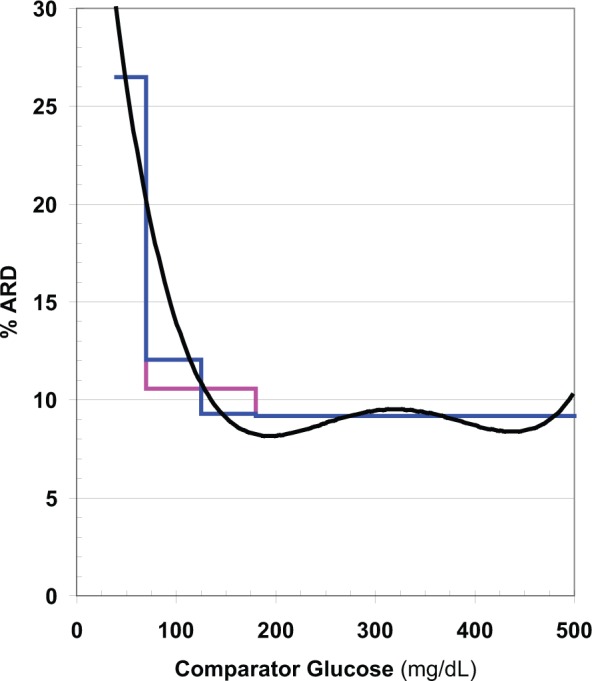
There is need for a method to describe precision and accuracy of glucose measurement as a smooth continuous function of glucose level rather than as a step function for a few discrete ranges of glucose. We propose and illustrate a method to generate a "Glucose Precision Profile" showing absolute relative deviation (ARD) and /or %CV versus glucose level to better characterize measurement errors at any glucose level. We examine the relationship between glucose measured by test and comparator methods using linear regression. We examine bias by plotting deviation = (test - comparator method) versus glucose level. We compute the deviation, absolute deviation (AD), ARD, and standard deviation (SD) for each data pair. We utilize curve smoothing procedures to minimize the effects of random sampling variability to facilitate identification and display of the underlying relationships between ARD or %CV and glucose level. AD, ARD, SD, and %CV display smooth continuous relationships versus glucose level. Estimates of MARD and %CV are subject to relatively large errors in the hypoglycemic range due in part to a markedly nonlinear relationship with glucose level and in part to the limited number of observations in the hypoglycemic range. The curvilinear relationships of ARD and %CV versus glucose level are helpful when characterizing and comparing the precision and accuracy of glucose sensors and meters.
Keywords: Bland–Altman plot; Clarke error grid; Parkes error grid; accuracy; bias; continuous glucose monitoring; diabetes mellitus type 1; diabetes mellitus type 2; glucose monitoring; mean absolute relative deviation (MARD); precision; precision absolute relative deviation (PARD); self-monitoring of blood glucose; statistical analysis.
© 2014 Diabetes Technology Society.
Conflict of interest statement
Figures
References
-
- Garg S, Zisser H, Schwartz S, et al. Improvement in glycemic excursions with a transcutaneous, real-time continuous glucose sensor. Diabetes Care. 2006;29:44-50. - PubMed
-
- Mastrototaro J, Shin J, Marcus A, Sulur G. The accuracy and efficacy of real-time continuous glucose monitoring sensor in patients with type 1 diabetes. Diabetes Technol Ther. 2008;10(5):385-390. - PubMed
Publication types
MeSH terms
Substances
LinkOut - more resources
Full Text Sources
Other Literature Sources
Medical
