. 2014 Sep;10(9):723-31.
doi: 10.1038/nchembio.1584. Epub 2014 Jul 20.

How proteins bind macrocycles

Affiliations

How proteins bind macrocycles

Elizabeth A Villar et al. Nat Chem Biol. 2014 Sep.

Abstract

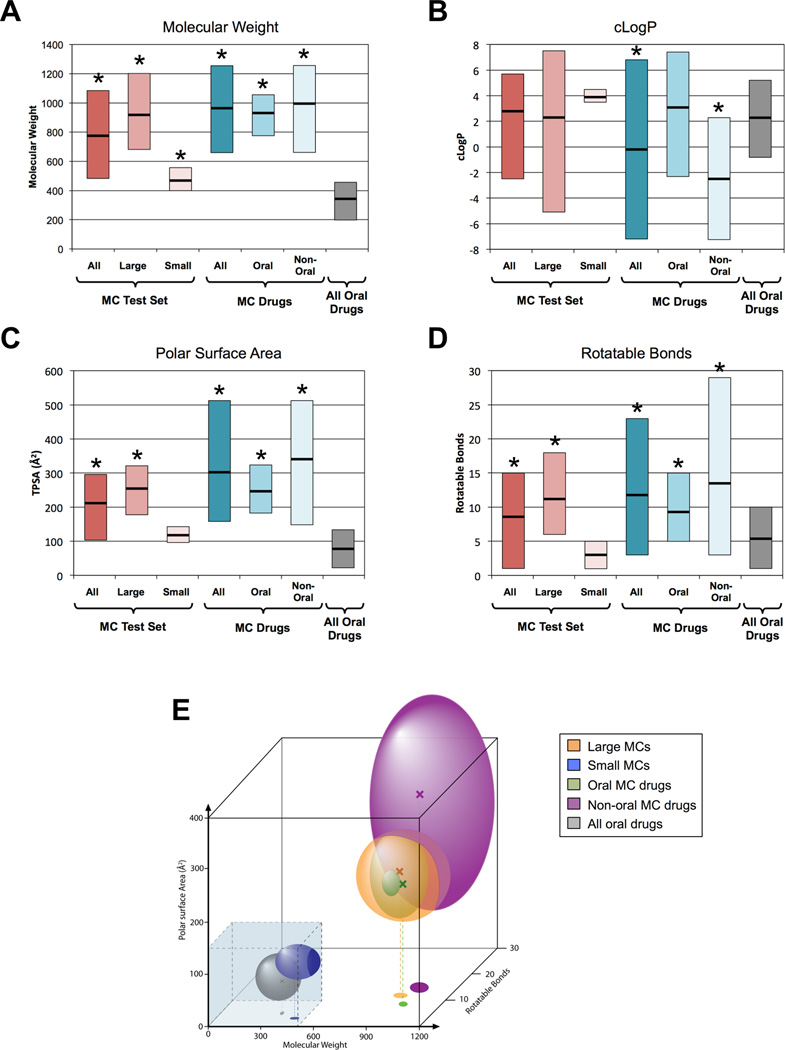
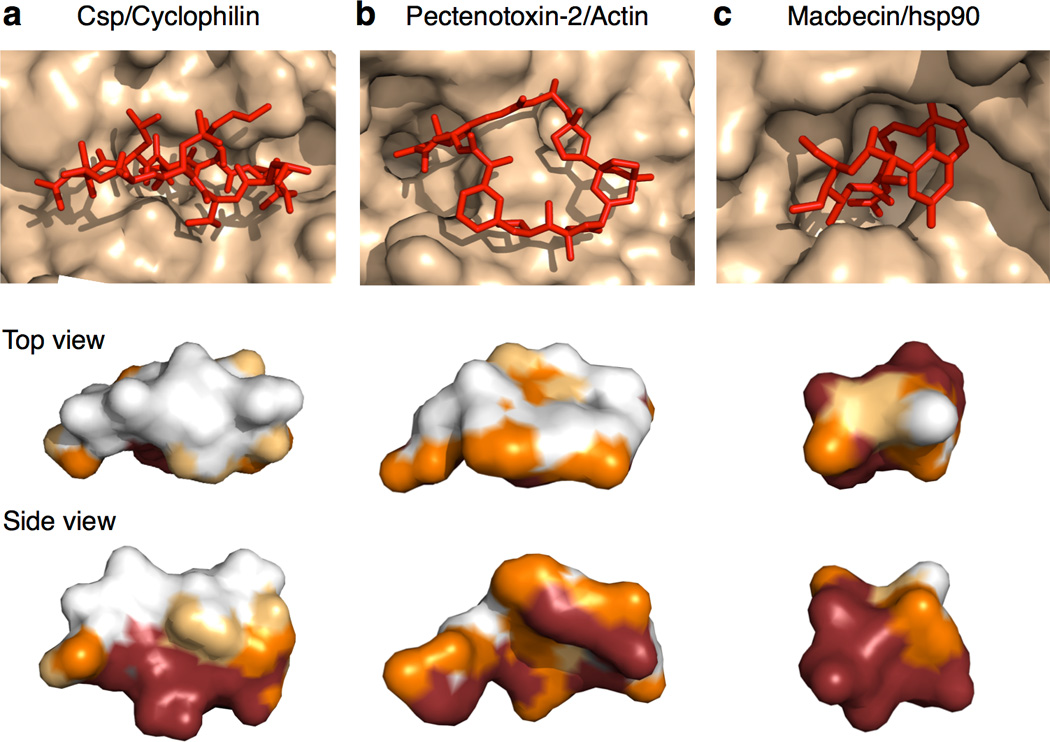
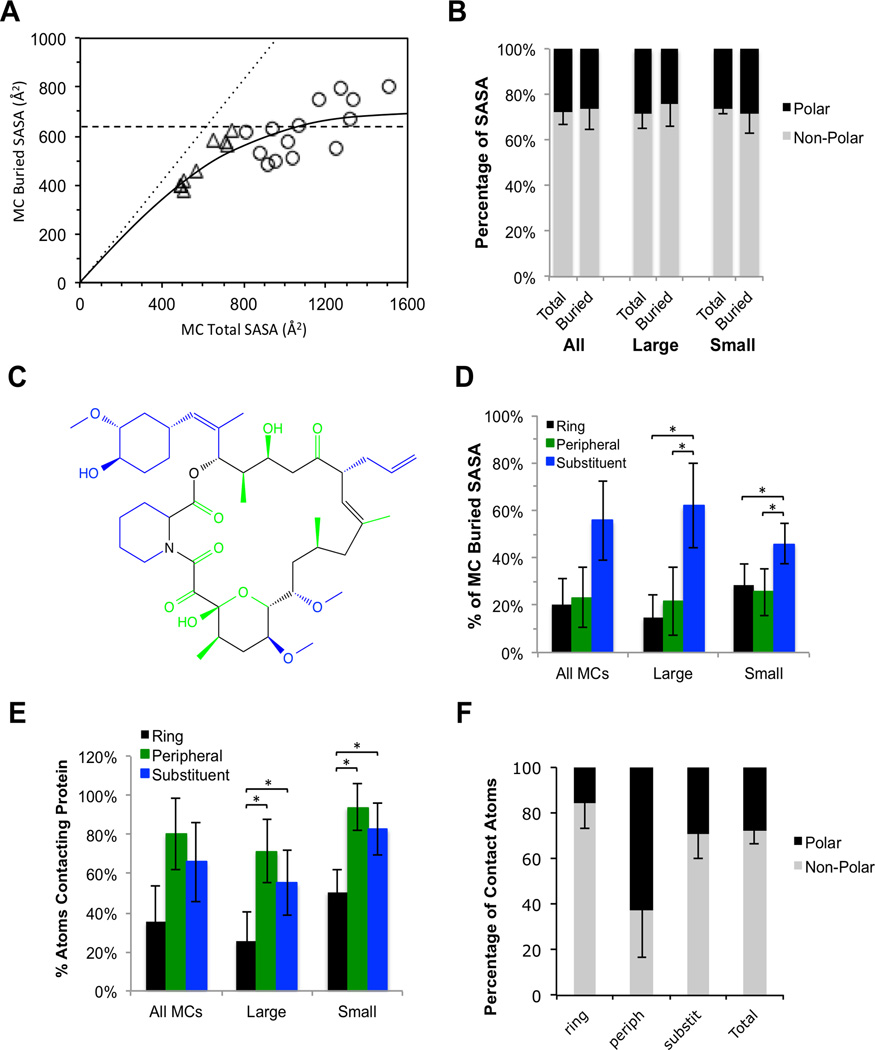
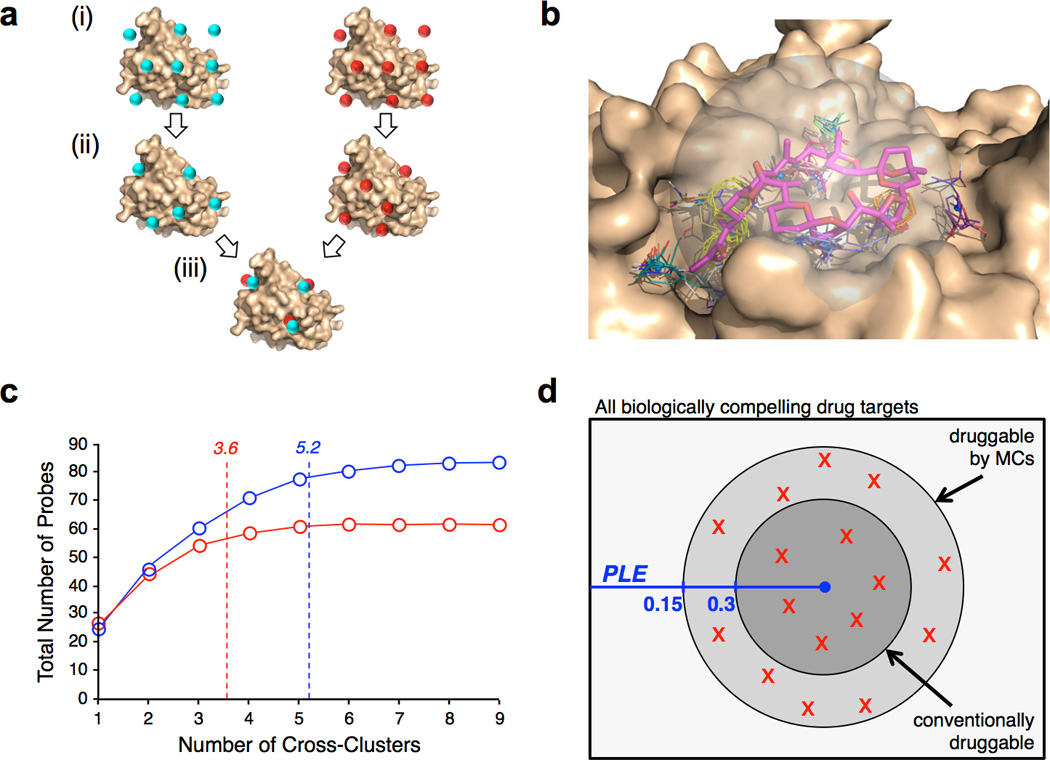
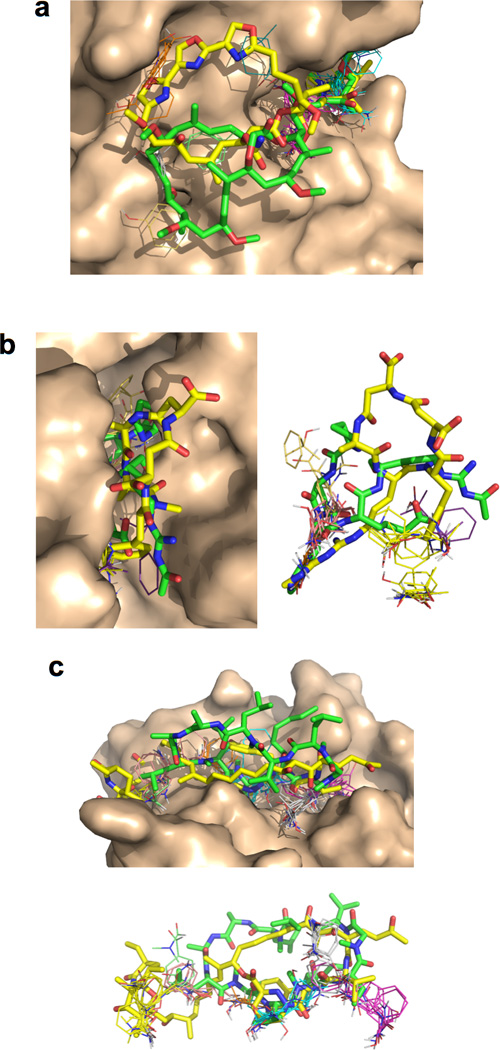
The potential utility of synthetic macrocycles (MCs) as drugs, particularly against low-druggability targets such as protein-protein interactions, has been widely discussed. There is little information, however, to guide the design of MCs for good target protein-binding activity or bioavailability. To address this knowledge gap, we analyze the binding modes of a representative set of MC-protein complexes. The results, combined with consideration of the physicochemical properties of approved macrocyclic drugs, allow us to propose specific guidelines for the design of synthetic MC libraries with structural and physicochemical features likely to favor strong binding to protein targets as well as good bioavailability. We additionally provide evidence that large, natural product-derived MCs can bind targets that are not druggable by conventional, drug-like compounds, supporting the notion that natural product-inspired synthetic MCs can expand the number of proteins that are druggable by synthetic small molecules.


Figures

Figure 1
Figure 1
Properties of MCs in the test set, compared to MC drugs and to all oral drugs. (a)–(d) Physicochemical properties relevant to druglikeness for the MCs from the test set, in comparison to the 18 oral MC drugs and the 26 non-oral MC drugs from Supplementary Table 1, and also 1193 oral drugs described previously. The bold horizontal lines indicate the mean value, and the vertical bars show the 10–90% value range. An asterisk (*) indicates that the mean value differs from that for all oral drugs at the P < 0.05 significance level, calculated using classical (non-paired) t-tests after establishing sample normality using the Anderson-Darling test (see Methods). Numerical values for these and other properties are collected in Supplementary Table 2. (e) Conventional drugs and MC drugs occupy distinct regions of chemical space. The spheroids represent approximately the 10th–90th percentile range of values observed for molecular weight, polar surface area and number of rotatable bonds (NRB). The colored “X” symbols show the mean values for each compound class, and the dashed lines show the projection of the mean values on the MW versus NRB axes that represent the floor of the plot. The transparent blue box shows the range of property values encompassed by Lipinski’s “Rule of Five” (MW ≤ 500 Da) and Veber’s Rules (PSA ≤ 140 Å2NRB ≤10).
Figure 2
Figure 2
MC Binding Modes. (a) Edge-on binding mode, as exemplified by cyclosporin (Csp) binding to cyclophilin. MCs that bind edge-on typically adopt a conformation in which the ring is flattened and elongated, such that even substituents attached to the solvent-exposed edge of the ring can reach to make extensive contact with the protein. (b) Face-on binding mode, exemplified by the binding of Pectenotoxin-2 to actin. MCs that bind face-on typically project a large substituent into a substantial neighboring pocket or cleft. (c) Compact binding mode observed for most of the small MCs, exemplified by Macbecin bound to hsp90. Upper panel shows the conformation of the ligand (red) when bound to its protein target (wheat). The images below show surface representations of the MC ligands from the upper panels, viewed looking down on the exposed portion of the compound (upper image) and from the side (lower image), with the ligand atoms color-coded according to how much contact they make with the protein (Red ≥ 90% buried, orange = 50–90 % buried, Yellow = 25–50% buried, and White = <25% buried).
Figure 3
Figure 3
Extent and character of the protein-MC binding interface. (a) Plot of buried SASA versus total SASA. The dotted line represents the line of identity, corresponding to 100% of MC SASA buried in the complex. Small MCs (triangles) bury ~80% of their SASA upon binding, with the size of the binding interface being roughly proportional to the surface area of the MC ligand. The large MCs (circles) bury a roughly constant 630 ± 150 Å2 of SASA (dashed line), with only a small dependence on compound size. The solid curve is an arbitrary interpolation of the data. (b) Comparison of the fraction of MC atoms that make direct contact with the protein (defined as atoms burying >5 Å2 of MC SASA) that are polar versus nonpolar, versus the corresponding ratio for all MC atoms. (c) Example showing how MC heavy atoms can be categorized by region into ring atoms (black), substituent atoms (blue) and “peripheral” atoms (green). (d) Contributions to total MC buried surface by region. (e) Percentage of atoms from each region that make direct contact with the protein (defined as atoms burying >5 Å2 of MC SASA). (f) Average polar/nonpolar ratio for the atoms from each MC region that make contact with the protein. Error bars are standard deviations; an asterisk (*) indicates that the specified difference is statistically significant using the Mann-Whitney U (rank) test (see Methods).
Figure 4
Figure 4
FTMap analysis of MC binding sites. (a) FTMap involves (i) placing probe molecules (represented by cyan or red spheres) on a dense grid around the protein, (ii) energy minimization and clustering to identify regions on the protein that interact most favorably with each probe type, and (iii) overlaying the results across all probe types to define “Cross-Clusters” (CCs) that identify binding energy hot spots(b) Representative result of FTMap analysis for Pectenotoxin-2 (magenta) bound to actin (wheat). CCs are shown as colored sticks. (c) Number of CCs occupied by ligands from the MC test set (blue) or the drug-like ligand comparator set (red). The plot shows the total number of probes the ligands overlap with, starting from the most highly-populated of the occupied CCs (ranked number 1) to the least populated (highest CC number), averaged over the entire set of complexes. The average number of CCs occupied is 5.2 for the MC ligands versus 3.6 for the druglike-ligands (p < 0.01; see Table 1). (d) Venn diagram illustrating the proposal that MCs can bind conventionally druggable targets, and also additional targets whose Potential Ligand Efficiency (PLE) falls below 0.3 kcal.mol−1/HA. The distribution of druggabilities observed for the 16 large MC binding sites assessed using FTMap are shown by red “X” symbols.
Figure 5
Figure 5
Comparison of binding modes for distinct MCs that bind at a common target site. (a) Reidispongiolide A (yellow) and Kabiramide C (green) bound to actin (wheat). The locations of the FTMap CCs are shown as colored sticks. Both compounds utilize the top two ranking hot spots, which line the site that accommodates their homologous large substituents, but the 26-member ring of RspA and the 25-atom ring of KabC exploit different sets of hot spots in their face-on interaction with the adjacent protein surface. (b) Argadin (green) and Argifin (yellow) bound to chitinase (wheat). Right panel is a superposition of the two ligands with the protein removed, to more clearly show the “head-to-tail” relationship between their binding modes, and the overlap with the FTMap CCs. (c) Cyclosporin A (green) and Sangliferhrin A (yellow) bound to cyclophilin (wheat). Lower panel is a superposition of the two ligands with the protein removed. The MC rings of these compounds bind edge-on, occupying largely similar sets of hot spots along the bottom of the binding cleft. But the large substituent of Sanglifehrin A reaches into a strong hot spot that is not exploited by Cyclosporin A, while an isobutyl substituent on the larger Cyclosporin A ring instead interacts with other hot spots not used by Sangliferhrin A.

References

    1. Hopkins AL, Groom CR. The druggable genome. Nat Rev Drug Discov. 2002;1:727–730. - PubMed
    1. Berg T. Small-molecule inhibitors of protein-protein interactions. Curr Opin Drug Discov Devel. 2008;11:666–674. - PubMed
    1. Buchwald P. Small-molecule protein-protein interaction inhibitors: therapeutic potential in light of molecular size, chemical space, and ligand binding efficiency considerations. IUBMB life. 2010;62:724–731. - PubMed
    1. Whitty A, Kumaravel G. Between a rock and a hard place? Nat Chem Biol. 2006;2:112–118. - PubMed
    1. Wells JA, McClendon CL. Reaching for high-hanging fruit in drug discovery at protein-protein interfaces. Nature. 2007;450:1001–1009. - PubMed

Publication types