. 2014 Aug;20(8):911-8.
doi: 10.1038/nm.3615. Epub 2014 Jul 20.

Inhibition of Notch signaling promotes browning of white adipose tissue and ameliorates obesity

Affiliations

Inhibition of Notch signaling promotes browning of white adipose tissue and ameliorates obesity

Pengpeng Bi et al. Nat Med. 2014 Aug.

Abstract

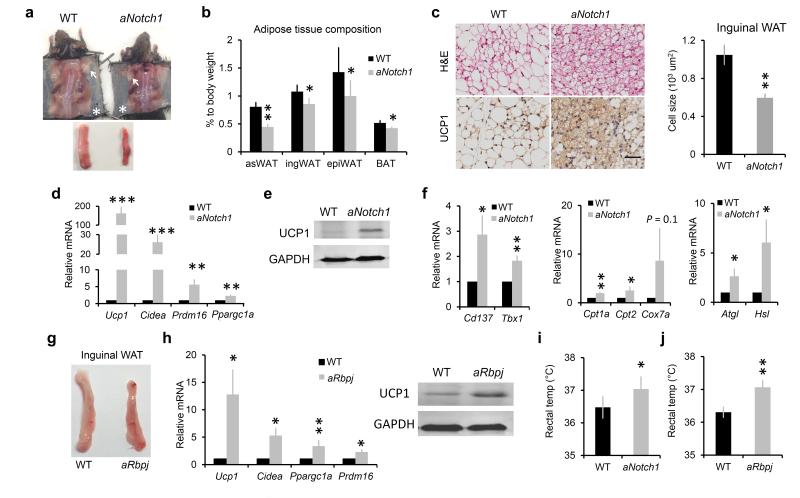
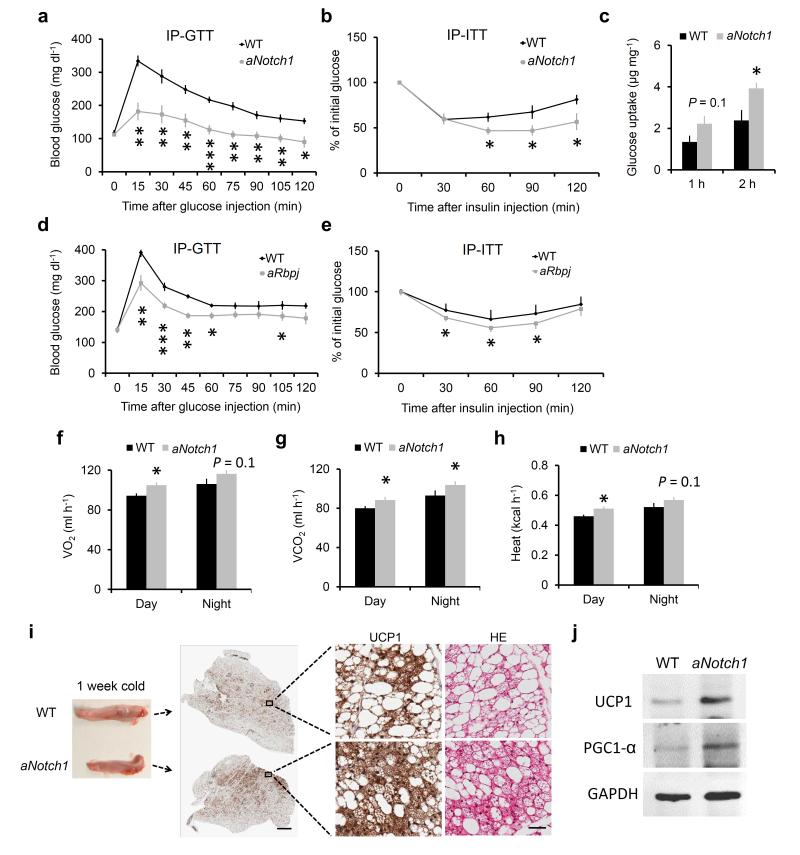
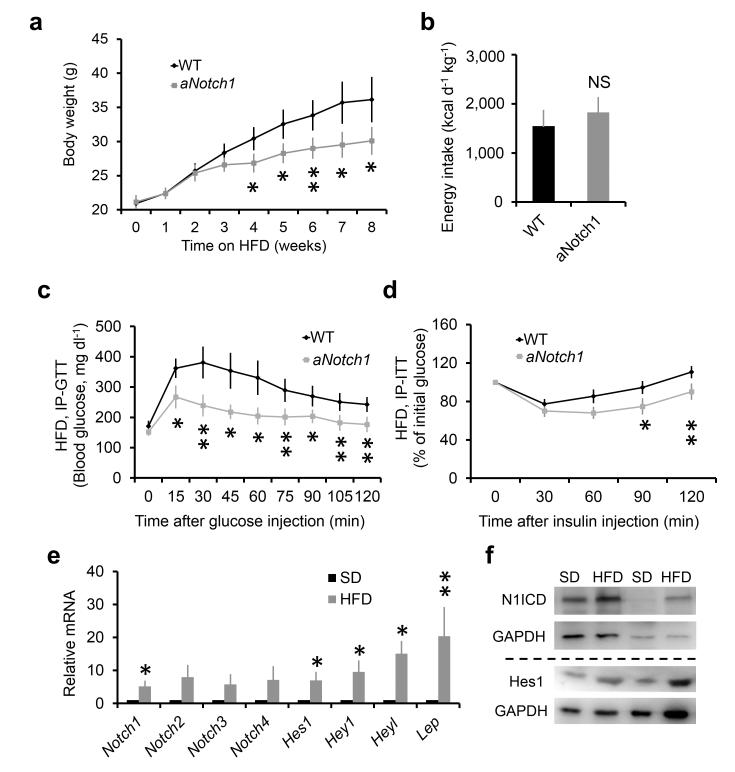
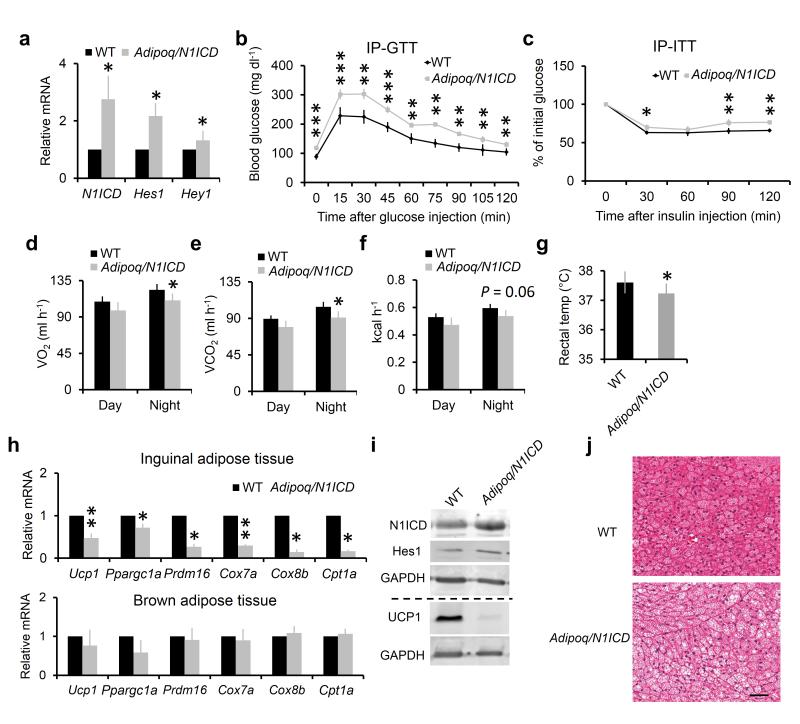
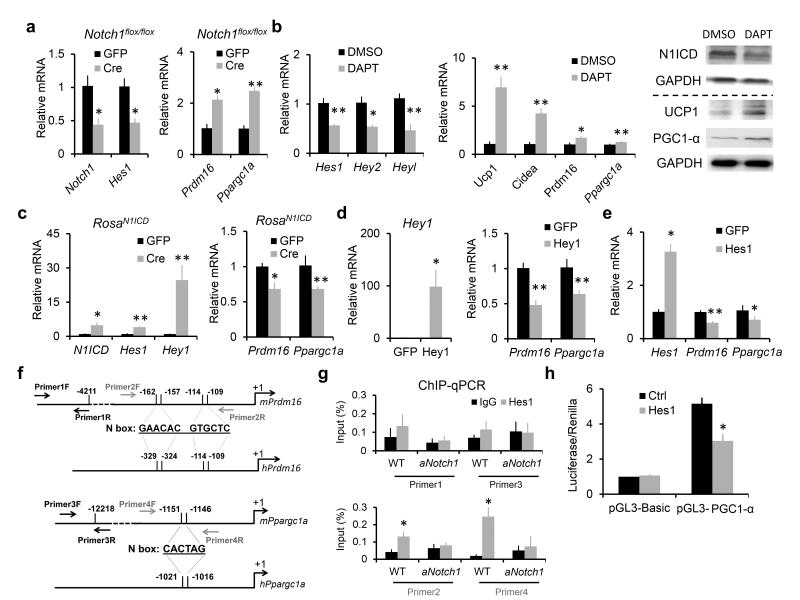
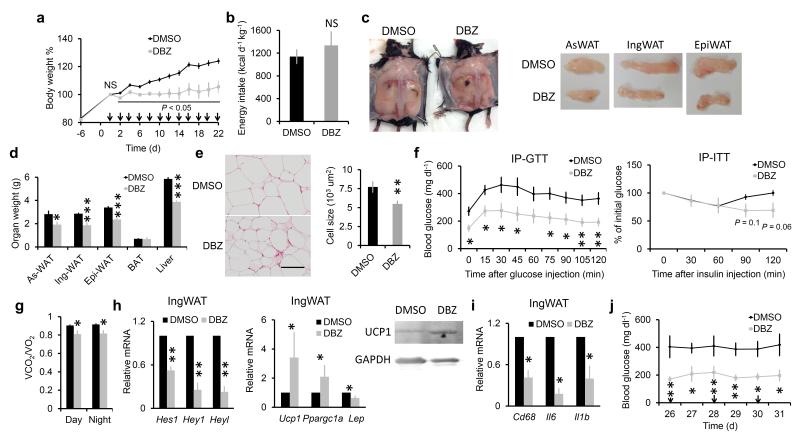
Beige adipocytes in white adipose tissue (WAT) are similar to classical brown adipocytes in that they can burn lipids to produce heat. Thus, an increase in beige adipocyte content in WAT browning would raise energy expenditure and reduce adiposity. Here we report that adipose-specific inactivation of Notch1 or its signaling mediator Rbpj in mice results in browning of WAT and elevated expression of uncoupling protein 1 (Ucp1), a key regulator of thermogenesis. Consequently, as compared to wild-type mice, Notch mutants exhibit elevated energy expenditure, better glucose tolerance and improved insulin sensitivity and are more resistant to high fat diet-induced obesity. By contrast, adipose-specific activation of Notch1 leads to the opposite phenotypes. At the molecular level, constitutive activation of Notch signaling inhibits, whereas Notch inhibition induces, Ppargc1a and Prdm16 transcription in white adipocytes. Notably, pharmacological inhibition of Notch signaling in obese mice ameliorates obesity, reduces blood glucose and increases Ucp1 expression in white fat. Therefore, Notch signaling may be therapeutically targeted to treat obesity and type 2 diabetes.


Figures

Figure 1
Figure 1
Browning phenotype of WAT in Notch mutant mice. (a) Representative images of anterior-subcutaneous WAT (arrows) and IngWAT (asterisks), lower panel shows IngWAT. (b) Ratio of adipose tissue weight to body weight, n = 7 except for epiWAT (n = 9). (c) Representative images of Hematoxylin & Eosin (H&E) and UCP1 staining of IngWAT (left), scale bar, 50 μm, and average inguinal adipocyte size (right). (df) Relative expression of genes in WT and aNotch1 IngWAT, (f middle, n = 6), (f right, n = 8). (g) Representative images of IngWAT from WT and aRbpj mice. (h) Gene expression in IngWAT. (i,j) Rectal temperature measurement, (j, n = 7). *P < 0.05, **P < 0.01, ***P < 0.001. Data are means ± SEM. n = 4 pairs of mice unless otherwise indicated.
Figure 2
Figure 2
Improved glucose metabolism in Notch mutant mice. (a,b) Blood glucose concentrations during IP-GTT (a) and IP-ITT (b) performed on 2–4 month-old WT and aNotch1 mice, n = 6. (c) Insulin stimulated glucose uptake of IngWAT explant from fasted 2–4 month-old WT (n = 4) and aNotch1 mice (n = 3). (d,e), IP-GTT (d, n = 4) and IP-ITT (e, n = 10) on 2–4 month-old WT and aRbpj mice. (f–h) Average day and night O2 consumption, CO2 production, and heat production, n = 6. (i) Representative histological analysis result of IngWAT from aNotch1 and WT mice treated at 4 °C for 1 week, scale bar, 1 mm (middle), 50 μm (right). (j) Western blot result of sample as in panel i. *P < 0.05, **P < 0.01, ***P < 0.001. Data are means ± SEM.
Figure 3
Figure 3
aNotch1 mice were resistant to HFD-induced obesity. (a,b) Growth curve (a) and energy intake assay (b, n = 4) of WT and aNotch1 fed with HFD. (c) Blood glucose concentrations during IP-GTT after glucose injection into fasted mice. (d) Blood glucose concentrations during IP-ITT after injecting insulin into fasted mice. (e) Gene expression assay of Notch receptors, Notch targets and Lep in WAT from 3 weeks’ standard diet (SD) and HFD fed mice, n = 8. (f) Representative result of western blot for Notch activity of sample as in e. *P < 0.05, **P < 0.01, ***P < 0.001. Data are means ± SEM. n = 5 pairs of mice unless otherwise indicated.
Figure 4
Figure 4
Activation of Notch1 in adipocytes inhibits browning and glucose metabolism. (a) Relative expression of N1ICD and its target genes in WAT. (b,c) Blood glucose concentrations during IP-GTT (b, n = 6) and IP-ITT (c) performed on 5–8 week-old WT and Adipoq/N1ICD mice. (d–f) O2 consumption (d), CO2 production (e), and heat production (f). (g) Rectal temperature, n = 5. (h) Relative expression of BAT and mitochondria marker genes in IngWAT (top) and BAT (bottom). (i) Western blot of IngWAT. (j) H&E staining of BAT section, scale bar, 50 μm. *P < 0.05, **P < 0.01, ***P < 0.001. Data are means ± SEM. n = 4 pairs of mice unless otherwise indicated.
Figure 5
Figure 5
Notch signaling inhibits expression of Ppargc1a and Prdm16 genes in cultured white adipocyte. (a) Gene expression of Notch1 and Hes1 (left), Prdm16 and Ppargc1a (right) in Notch1flox/flox preadipocytes after transfection with Cre or GFP plasmids (control). (b) Gene expression of Notch target (left), BAT-related genes (middle) and protein level of N1ICD, UCP1, PGC1-α (right) in cultured WT white adipocytes treated with DAPT during induction and differentiation, n = 6. (c) Gene expression in RosaN1ICD preadipocytes after transfection with Cre or GFP (control) plasmids. (d,e) Gene expression of WT preadipocytes after transfection with Hey1 (d) or Hes1 (e) plasmids. (f) Conserved N box domains on Prdm16 (top) and Ppargc1a (bottom) promoters of both human and mouse. (g) Chromatin immunoprecipitation (ChIP) using Hes1 antibody followed by qPCR assay, n = 4. (h) Luciferase assay of HEK293 cells after cotransfection of pGL3-PGC1-α (or pGL3-Basic) plasmids with Renilla plasmids and Hes1 (or its control, ctrl) plasmids, n = 5. *P < 0.05 and **P < 0.01. Data are means ± SEM. n = 3 unless otherwise indicated.
Figure 6
Figure 6
Inhibition of Notch in Lep deficient obese mice (Lepob) ameliorates obesity and glucose metabolism. (a) Body weight ratio normalized to day 0, arrows mark doses of DMSO or DBZ injection. (b) Energy intake assay. (c) WAT images, anterior subcutaneous WAT (as-WAT). (d) Tissue weight. (e) H&E staining result of IngWAT, and adipocyte size. (f) Plasma glucose measurement during IP-GTT (left), or during IP-ITT (right). (g) Respiration exchange ratio of mice after treated with DMSO or DBZ for 22 days. (h,i), Relative expression of Notch targets (h left), adipocyte genes (h middle), UCP1 protein (h right), and inflammation-related genes (i) in IngWAT. (j) Fed-plasma glucose concentrations at dates shown, arrows indicate DMSO or DBZ injection (started from day 0 as shown in panel a). *P < 0.05, **P < 0.01, ***P < 0.001. Data are means ± SEM, n = 5.

Comment in

References

    1. Smith RE. Thermoregulatory and Adaptive Behavior of Brown Adipose Tissue. Science. 1964;146:1686–1689. - PubMed
    1. Nedergaard J, Cannon B. The changed metabolic world with human brown adipose tissue: therapeutic visions. Cell Metab. 2010;11:268–272. - PubMed
    1. Rosen ED, Spiegelman BM. Adipocytes as regulators of energy balance and glucose homeostasis. Nature. 2006;444:847–853. - PMC - PubMed
    1. Tran TT, Kahn CR. Transplantation of adipose tissue and stem cells: role in metabolism and disease. Nat Rev Endocrinol. 2010;6:195–213. - PMC - PubMed
    1. van Marken Lichtenbelt WD, et al. Cold-activated brown adipose tissue in healthy men. N Engl J Med. 2009;360:1500–1508. - PubMed

Publication types

MeSH terms