

The R-factor gap in macromolecular crystallography: an untapped potential for insights on accurate structures
- PMID: 25040949
- PMCID: PMC4282448
- DOI: 10.1111/febs.12922
The R-factor gap in macromolecular crystallography: an untapped potential for insights on accurate structures
Abstract
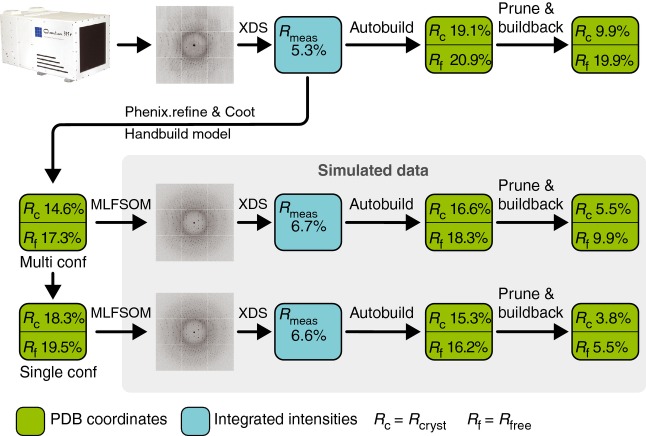
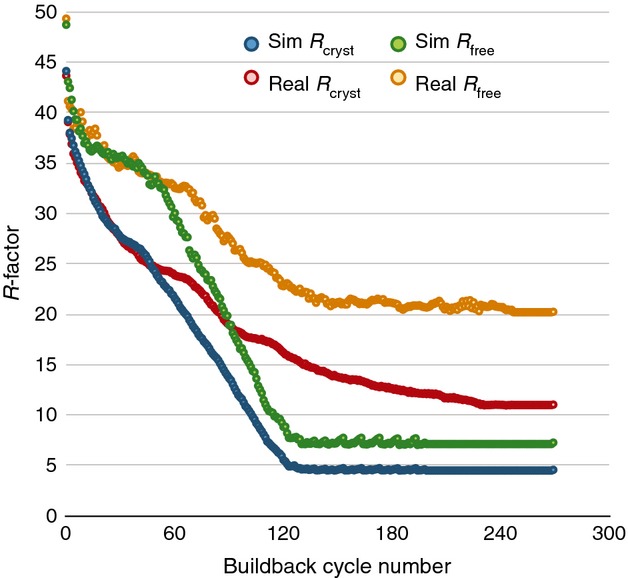
In macromolecular crystallography, the agreement between observed and predicted structure factors (Rcryst and Rfree ) is seldom better than 20%. This is much larger than the estimate of experimental error (Rmerge ). The difference between Rcryst and Rmerge is the R-factor gap. There is no such gap in small-molecule crystallography, for which calculated structure factors are generally considered more accurate than the experimental measurements. Perhaps the true noise level of macromolecular data is higher than expected? Or is the gap caused by inaccurate phases that trap refined models in local minima? By generating simulated diffraction patterns using the program MLFSOM, and including every conceivable source of experimental error, we show that neither is the case. Processing our simulated data yielded values that were indistinguishable from those of real data for all crystallographic statistics except the final Rcryst and Rfree . These values decreased to 3.8% and 5.5% for simulated data, suggesting that the reason for high R-factors in macromolecular crystallography is neither experimental error nor phase bias, but rather an underlying inadequacy in the models used to explain our observations. The present inability to accurately represent the entire macromolecule with both its flexibility and its protein-solvent interface may be improved by synergies between small-angle X-ray scattering, computational chemistry and crystallography. The exciting implication of our finding is that macromolecular data contain substantial hidden and untapped potential to resolve ambiguities in the true nature of the nanoscale, a task that the second century of crystallography promises to fulfill.
Database: Coordinates and structure factors for the real data have been submitted to the Protein Data Bank under accession 4tws.
Keywords: R-factor; R-value; crystallography; simulation; theoretical.
© 2014 The Authors. FEBS Journal published by John Wiley & Sons Ltd on behalf of FEBS.
Figures
References
-
- Perrin J. Mécanisme de la décharge des corps électrisés par les rayons de Röntgen. J Phys Theor Appl. 1896;5:350–357.
-
- Barkla CG. Secondary radiation from gases subject to X-rays. Philos Mag. 1903;5:685–698.
-
- Bragg WH. Bragg WL. The reflection of X-rays by crystals. Proc R Soc Lond A. 1913;88:428–438.
-
- Schweigger JSC. Zusätze zu Oersteds elektromagnetischen Versuchen. Neues J Chem Phys. 1820;1:1–17.
-
- Ampére A-M. Théorie Mathématique des Phénomenes Électro-Dynamiques Uniquement Déduite de l'Expérience. Paris: A. Hermann; 1825.
Publication types
MeSH terms
Substances
Grants and funding
LinkOut - more resources
Full Text Sources
Other Literature Sources
Miscellaneous
