

Getting started with microbiome analysis: sample acquisition to bioinformatics
- PMID: 25042718
- PMCID: PMC4383038
- DOI: 10.1002/0471142905.hg1808s82
Getting started with microbiome analysis: sample acquisition to bioinformatics
Abstract
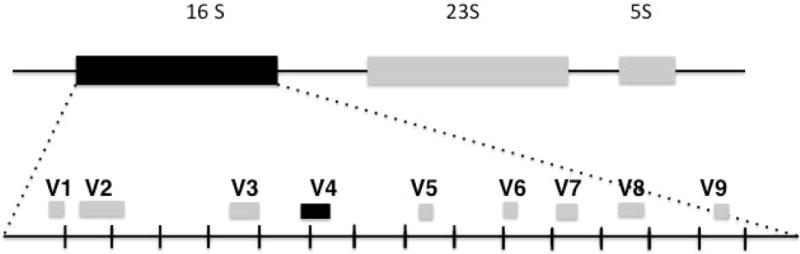
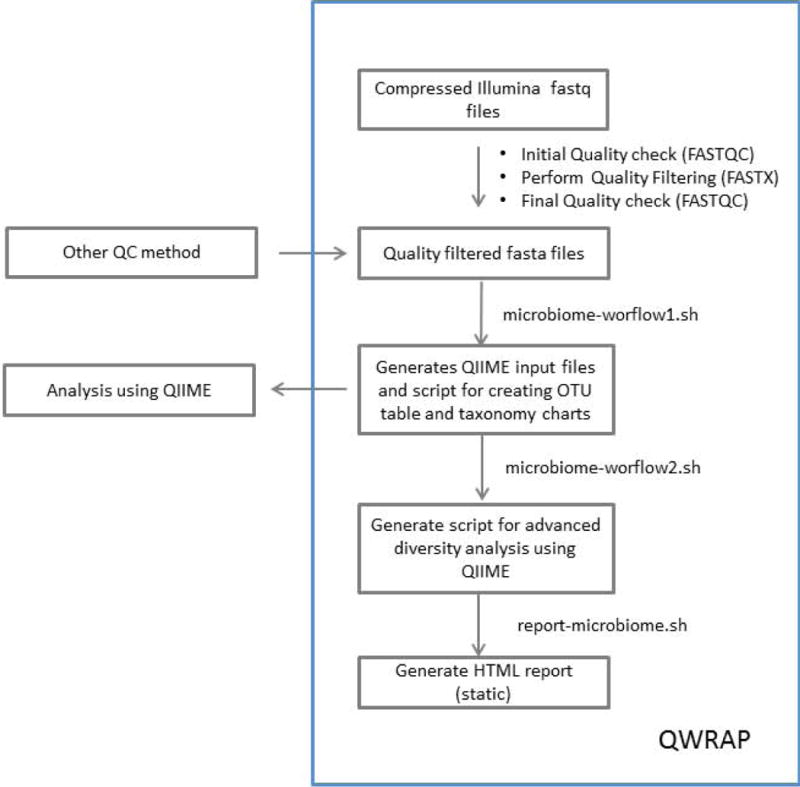
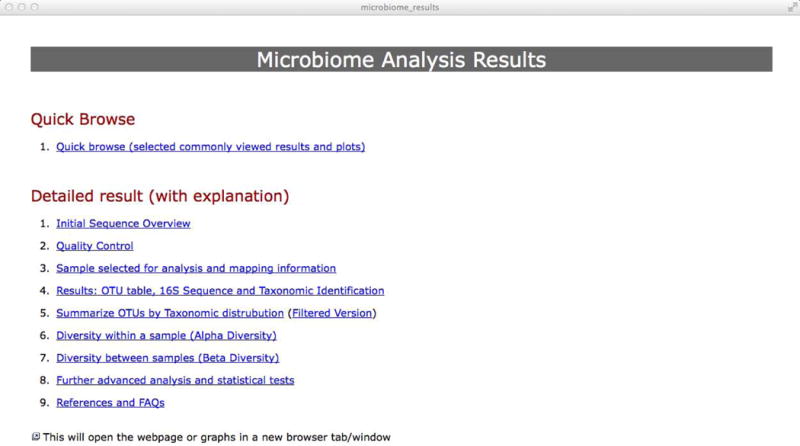
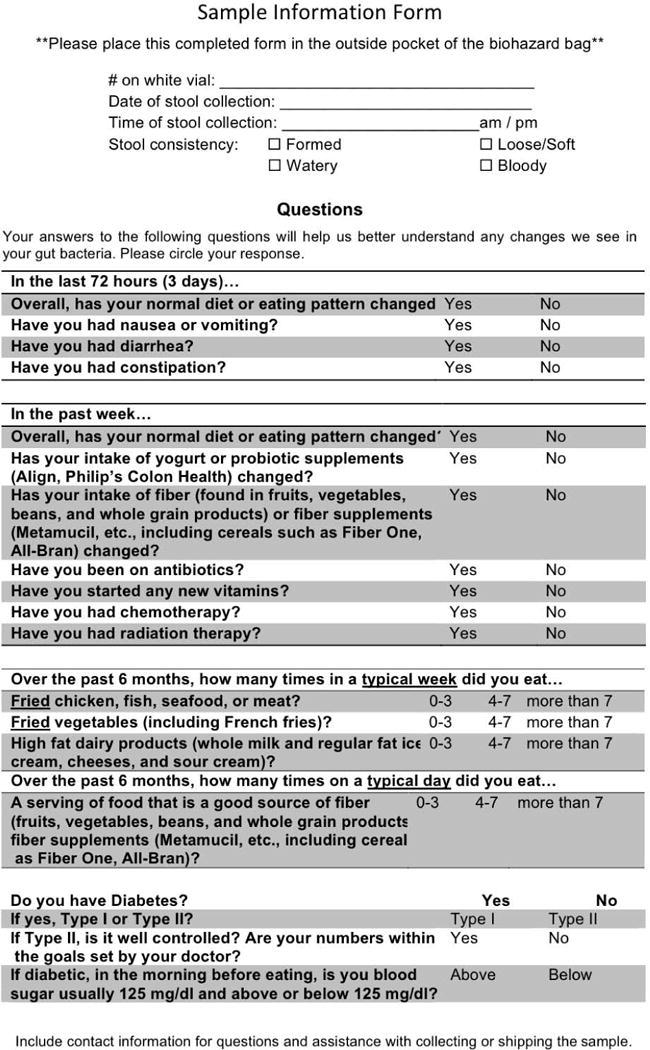
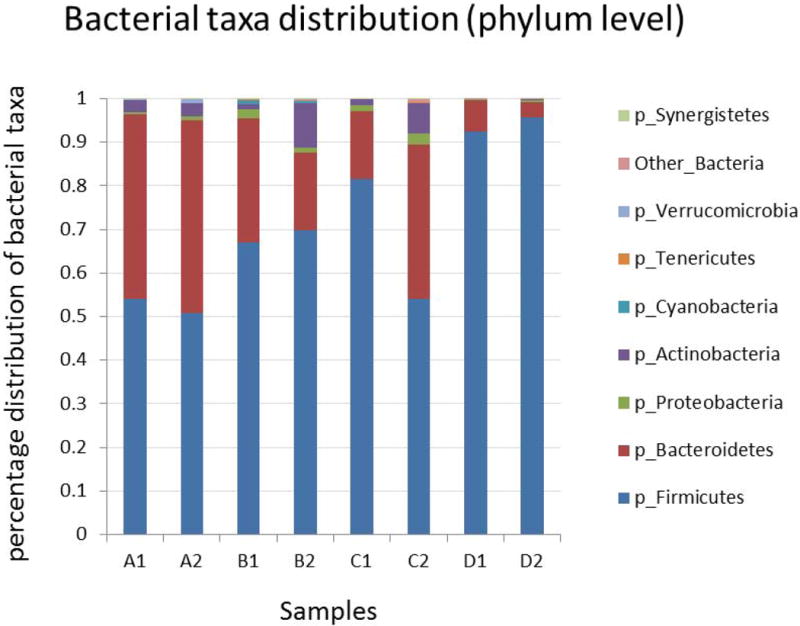
Historically, in order to study microbes, it was necessary to grow them in the laboratory. It was clear though that many microbe communities were refractory to study because none of the members could be grown outside of their native habitat. The development of culture-independent methods to study microbiota using high-throughput sequencing of the 16S ribosomal RNA gene variable regions present in all prokaryotic organisms has provided new opportunities to investigate complex microbial communities. In this unit, the process for a microbiome analysis is described. Many of the components required for this process may already exist. A pipeline is described for acquisition of samples from different sites on the human body, isolation of microbial DNA, and DNA sequencing using the Illumina MiSeq sequencing platform. Finally, a new analytical workflow for basic bioinformatics data analysis, QWRAP, is described, which can be used by clinical and basic science investigators.
Keywords: 16S rRNA genes; QWRAP bioinformatics analysis; microbe communities; microbiome analysis pipeline.
Copyright © 2014 John Wiley & Sons, Inc.
Figures
References
-
- Altschul SF, Gish W, Miller W, Myers EW, Lipman DJ. Basic local alignment search tool. Journal of Molecular Biology. 1990;215:403–410. - PubMed
-
- Arumugam M, Raes J, Pelletier E, Le Paslier D, Yamada T, Mende DR, Fernandes GR, Tap J, Bruls T, Batto JM, Bertalan M, Borruel N, Casellas F, Fernandez L, Gautier L, Hansen T, Hattori M, Hayashi T, Kleerebezem M, Kurokawa K, Leclerc M, Levenez F, Manichanh C, Nielsen HB, Nielsen T, Pons N, Poulain J, Qin J, Sicheritz-Ponten T, Tims S, Torrents D, Ugarte E, Zoetendal EG, Wang J, Guarner F, Pedersen O, de Vos WM, Brunak S, Dore J, Antolin M, Artiguenave F, Blottiere HM, Almeida M, Brechot C, Cara C, Chervaux C, Cultrone A, Delorme C, Denariaz G, Dervyn R, Foerstner KU, Friss C, van de Guchte M, Guedon E, Haimet F, Huber W, van Hylckama-Vlieg J, Jamet A, Juste C, Kaci G, Knol J, Lakhdari O, Layec S, Le Roux K, Maguin E, Merieux A, Melo Minardi R, M’Rini C, Muller J, Oozeer R, Parkhill J, Renault P, Rescigno M, Sanchez N, Sunagawa S, Torrejon A, Turner K, Vandemeulebrouck G, Varela E, Winogradsky Y, Zeller G, Weissenbach J, Ehrlich SD, Bork P. Enterotypes of the human gut microbiome. Nature. 2011;473:174–180. - PMC - PubMed
-
- Caporaso JG, Lauber CL, Walters WA, Berg-Lyons D, Lozupone CA, Turnbaugh PJ, Fierer N, Knight R. Global patterns of 16S rRNA diversity at a depth of millions of sequences per sample. Proceedings of the National Academy of Sciences of the United States of America. 2011;108(Suppl 1):4516–4522. - PMC - PubMed
Publication types
MeSH terms
Substances
Grants and funding
LinkOut - more resources
Full Text Sources
Other Literature Sources
