

doi: 10.1038/nmeth.3035.
Epub 2014 Jul 20.
Single-cell genome-wide bisulfite sequencing for assessing epigenetic heterogeneity
Affiliations
- PMID: 25042786
- PMCID: PMC4117646
- DOI: 10.1038/nmeth.3035
Item in Clipboard
Single-cell genome-wide bisulfite sequencing for assessing epigenetic heterogeneity
Nat Methods.
2014 Aug.
Abstract
We report a single-cell bisulfite sequencing (scBS-seq) method that can be used to accurately measure DNA methylation at up to 48.4% of CpG sites. Embryonic stem cells grown in serum or in 2i medium displayed epigenetic heterogeneity, with '2i-like' cells present in serum culture. Integration of 12 individual mouse oocyte datasets largely recapitulated the whole DNA methylome, which makes scBS-seq a versatile tool to explore DNA methylation in rare cells and heterogeneous populations.
Figures
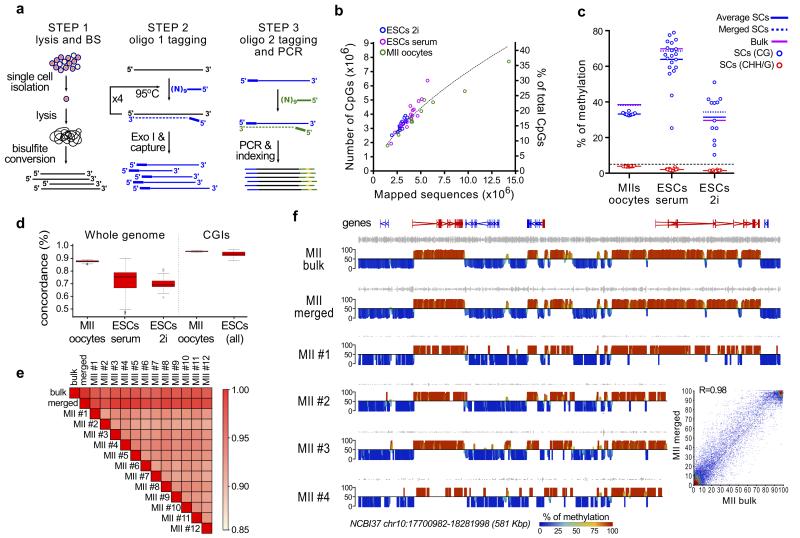
(a) scBS-Seq library preparation is performed in three stages: (1) single cells are isolated and lysed before bisulfite conversion is performed; (2) five rounds of random priming and extension are performed using oligo1 (which carries the first sequencing adaptor) and newly synthesized fragments are purified; (3) a second random priming and extension step is performed using oligo2 (which carries the second sequencing adaptor) and the resulting fragments are amplified by PCR. (b) Number of CpGs obtained by scBS-Seq correlates with the number of mapped sequences. (c) Global level of DNA methylation in a CpG and non-CpG context for single cells, in silico merged, and bulk samples. (d) Boxplot representation of the pairwise analysis of CpG concordance genome-wide and in unmethylated CGIs. Boxplots (plotted using the R package) represent the interquartile range, with the median. (e) Pairwise correlation matrix (Pearson’s; 2kb windows) for MII bulk, individual MIIs, and in silico merged MII scBSSeq datasets. (f) Screenshots showing CpG methylation (%) quantified over 2kb windows, with red indicating high methylation and blue low methylation. Data are displayed for four single MII libraries and the in silico merged dataset from all 12 MIIs (MII merged), which closely resemble the methylation landscape of the bulk MII sample. The inset shows the correlation between MII bulk and MII merged.
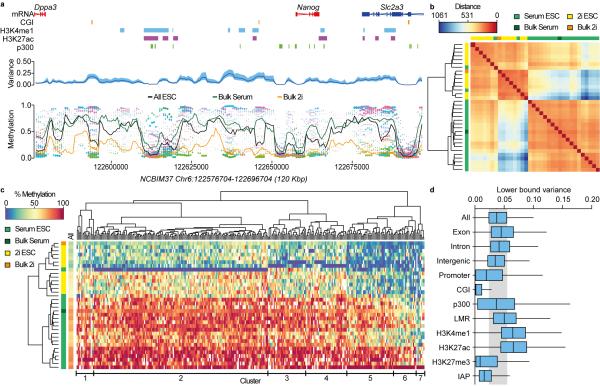
(a) DNA methylation rates were estimated for each ESC using a sliding window across the genome (each cell is represented by a different color in the bottom panel, size of dot is the inverse of estimation error). The mean methylation rate across cells (black line in bottom panel) and the cell-to-cell variance (blue line in middle panel, 95% confidence interval shaded in light blue) were also estimated. The methylation rates for Bulk serum (green line) and Bulk 2i (orange line) are superimposed in the bottom panel. The region shown as an example includes the Nanog locus with some annotated features. (b) Genome-wide cluster dendrogram and distance matrix for all ESCs and Bulk samples based on the estimated methylation rates. Distance refers to the weighted Euclidean norm between estimated methylation rates. (c) Heatmap for methylation rates of the top 300 most variable sites among single-cell ESC samples. Cluster dendrograms for samples (left) and sites (top) are shown. The genome-wide average methylation rate is displayed in the left track (‘All’). The main clusters of variable sites are indicated at the bottom. (d) Variance of sites located in different genomic contexts. Boxplots represent the interquartile range, with the median. The upper (lower) whiskers correspond to 1.5 times the interquartile range. The shaded gray region indicates the interquartile range for all genome-wide sites.
References
Publication types
MeSH terms
Substances
Grants and funding
LinkOut - more resources
Full Text Sources
Other Literature Sources
Molecular Biology Databases
