. 2014 Aug 14;512(7513):218-222.
doi: 10.1038/nature13430. Epub 2014 Jun 22.

Visualization of arrestin recruitment by a G-protein-coupled receptor

Affiliations

Visualization of arrestin recruitment by a G-protein-coupled receptor

Arun K Shukla et al. Nature. .

Abstract

G-protein-coupled receptors (GPCRs) are critically regulated by β-arrestins, which not only desensitize G-protein signalling but also initiate a G-protein-independent wave of signalling. A recent surge of structural data on a number of GPCRs, including the β2 adrenergic receptor (β2AR)-G-protein complex, has provided novel insights into the structural basis of receptor activation. However, complementary information has been lacking on the recruitment of β-arrestins to activated GPCRs, primarily owing to challenges in obtaining stable receptor-β-arrestin complexes for structural studies. Here we devised a strategy for forming and purifying a functional human β2AR-β-arrestin-1 complex that allowed us to visualize its architecture by single-particle negative-stain electron microscopy and to characterize the interactions between β2AR and β-arrestin 1 using hydrogen-deuterium exchange mass spectrometry (HDX-MS) and chemical crosslinking. Electron microscopy two-dimensional averages and three-dimensional reconstructions reveal bimodal binding of β-arrestin 1 to the β2AR, involving two separate sets of interactions, one with the phosphorylated carboxy terminus of the receptor and the other with its seven-transmembrane core. Areas of reduced HDX together with identification of crosslinked residues suggest engagement of the finger loop of β-arrestin 1 with the seven-transmembrane core of the receptor. In contrast, focal areas of raised HDX levels indicate regions of increased dynamics in both the N and C domains of β-arrestin 1 when coupled to the β2AR. A molecular model of the β2AR-β-arrestin signalling complex was made by docking activated β-arrestin 1 and β2AR crystal structures into the electron microscopy map densities with constraints provided by HDX-MS and crosslinking, allowing us to obtain valuable insights into the overall architecture of a receptor-arrestin complex. The dynamic and structural information presented here provides a framework for better understanding the basis of GPCR regulation by arrestins.


Figures
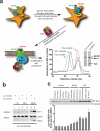
Figure 1
Figure 1. Formation and functional characterization of a stable agonist-β2V2R-βarr1 signaling complex
a. Schematic flowchart of a novel purification strategy to isolate β2V2R-βarr1-Fab30 complex and large scale production and separation of agonist-β2V2R-βarr1-Fab30/ScFv30 complex from the free receptor by size exclusion chromatography (Superdex 200, 16/600 prep grade). T4 lysozyme sequence is attached at the N-terminus of the β2AR. b. Isolation of β2V2R-βarr1 complex requires Fab30 and it is agonist dependent. Cells were stimulated either with inverse agonist (ICI-118551) or agonist (BI-167107) followed by incubation with or without Fab and subsequent purification on FLAG M1 beads. c. Formation of β2V2R-βarr1-Fab30 complex follows ligand efficacy. Formation of the complex in response to inverse agonists, partial agonists and full agonists is shown. The data is representative of 7 independent experiments.
Figure 2
Figure 2. Hydrogen-deuterium exchange mass spectrometry (HDXMS) analysis reveals potential interface between β2V2R and βarr1
Differential hydrogen-deuterium exchange (HDX) rates of βarr1 in the β2V2R-βarr1-Fab30 vs. V2Rpp-βarr1-Fab30 were mapped on to the βarr1 crystal structure (PDB: 4JQI). Blue and red color coding suggest the βarr1 regions which exchange slower and faster, respectively, in the β2V2R-βarr1-Fab30 complex when compared to the V2Rpp-βarr1-Fab30 complex. Some regions (boxed) with significant HDX rate changes are enlarged in the panels (a)-(c). The HDX rates of the finger loop (residues 63-75) (a), middle loop (residues 129-140) (b) and lariat loop (residues 274-300) (b) became slower, whereas those of other regions, for example, (c) the β-strand I (βI), II (βII) and X (βX) in the N-domain became faster in the β2V2R-βarr1-Fab30 complex when compared to the V2Rpp-βarr1-Fab30 complex.
Figure 3
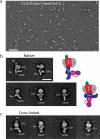
Figure 3. Single particle EM analysis of the β2V2R-βarr1-Fab30/ScFv30 complex
a. Representative raw EM image of negative stained T4L-β2V2R-βarr1-Fab30/ScFv30 complexes. Scale bar = 25 nm. b. Representative class averages of the native T4L-β2V2R-βarr1-Fab30/ScFv30 complex. Class averages of particles displaying the loose “hanging” interaction (top) and the fully engaged “tight” interaction (bottom) are presented. Scale bar = 10 nm. c. Representative class averages of the “on-column” cross-linked T4L-β2V2R-βarr1-Fab30/ScFv30 complex. Upon cross-linking, the majority of class averages display the “tight” (fully engaged) βarr1 conformation, similar to a fraction (~37%) of particles observed in the non-cross-linked complex.
Figure 4
Figure 4. Structural model of the β2V2R-βarr1-Fab30 complex
a. Views of the T4L-β2V2R-βarr1-Fab30 complex 3D reconstruction with modeled T4L-β2AR (green-orange, pdb: 3SN6), βarr1 (blue, pdb: 4JQI), and Fab30 (purple, pdb: 4JQI) crystal structures. The density surrounding β2V2R represents the LMNG detergent micelle and is marked by “m”. b. Views of the β2V2R-βarr1 interface within the dashed line square of panel (a). Areas of βarr1 with reduced deuterium exchange are shown in cyan. Cross-linked Lys235 of β2V2R and Lys77 of βarr1 are highlighted. c. Illustration of the two-step GPCR-βarr1 interaction using surface representations of the structures of β2AR (orange), the phosphorylated C-terminal tail of V2R (yellow) and βarr1 (blue). The C-terminal portion of the V2R peptide (Glu355 - Asp367) in the right model is positioned as found in the βarr1-Fab30-V2Rpp structure (pdb:4JQI), whereas the N-terminal portion (Ala342 – Pro352) was remodeled to connect to the β2AR C-terminus.
Extended Data Figure 1
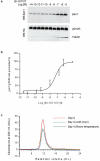
Extended Data Figure 1. Formation of the β2V2R-βarr1-Fab30 complex follows agonist occupancy of the receptor and it is biochemically stable
a. Sf9 cells co-expressing the β2V2R, βarr1 and GRK2CAAX were stimulated with varying doses of high affinity agonist BI-167107 followed by addition of Fab30 and purification of the complexes. Stimulation of cells with increasing concentration of BI-167107 results in increasing amount of βarr1 co-purification indicating a direct correlation between occupancy of the receptor with agonist and complex formation. b. Quantification of agonist dependent complex formation from seven independent experiments normalized with respect to βarr1 signal at highest agonist concentration. c. Purified T4L-β2V2R-βarr1-Fab30 complex was stored either at 4°C or at room temperature for 4 days followed by size exclusion chromatography on a superdex 200 (10/300) column (flow rate 0.5 ml/min). No significant dissociation of the complex was detected as monitored by appearance of a peak corresponding to the receptor (13.5 ml) or βarr1 (14.5 ml).
Extended Data Figure 2
Extended Data Figure 2. Functionally relevant conformation of βarr1 in the T4L-β2V2R-βarr1-Fab30 complex as revealed by enhanced clathrin -terminal domain (clathrin TD) interaction
Purified GST (glutathione S-transferase) tagged clathrin-TD was added to the purified complex or equivalent amount of βarr1 alone. Interaction of clathrin-TD with the complex or βarr1 was measured by subsequent co-immunoprecipitation and Western blot analysis. Quantification of four independent experiments shown as a bar graph. The relative intensities of the βarr1 bands are normalized with respect to βarr1 alone (set as 1). A coomassie stained gel indicating comparable amounts of βarr1 for complex vs. βarr1 alone conditions in clathrin-TD coimmunoprecipitation experiments is shown on the left. Errror bar shows SEM. p<0.05 for paired t-test.
Extended Data Figure 3
Extended Data Figure 3. HDXMS analysis and mass-spectrometry based mapping of the cross-linking site in T4L-β2V2R-βarr1-Fab30 complex.
a. The differential H/D exchange between the T4Lβ2V2R-βarr1-Fab30 complex and the V2Rpp-βarr1-Fab30 complex are mapped on the sequence of βarr1. b. Disuccinimidyl adipate (DSA), a homobifunctional amine-reactive crosslinker) was used to cross-link the pre-formed T4L-β2V2R-βarr1-Fab30 complex. c. A representative SDS-PAGE showing the DSA cross-linking efficiency of the pre-formed complex. d. The cross-linked peptides were characterized with “doublet” peak signatures in mass spectra as described in the methods section and revelaed a cross-link between K235 of the β2V2R and K77 at the distal end of the finger loop in βarr1. e. Structural model of the β2V2R-βarr1complex highlighting the cross-linking site.
Extended Data Figure 4
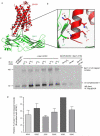
Extended Data Figure 4. Disulphide trapping strategy reveals close proximity of residue 235 of the β2V2R and residue 78 at the distal end of the finger loop in βarr1.
a. Structural model of the β2V2R-βarr1 complex depicting the proximity of K235 on the β2V2R and D78 on βarr1. b. Single cysteine insertion mutants of the β2V2R (covering residues 231- 236 ) and βarr1D78C were co-transfected in HEK-293 cells and complex formation was induced by stimulating the cells with an oxidizing agent H2O2 and agonist (Isoproterenol; Iso). Subsequenlty, a co-immunoprecipitation assay was performed using FLAG M2 beads (FLAG-βarr1). Formation of disulphide trapped complex was visualized by Western blotting. c. Quantification of βarr1 in S-S trapped complex from three indepdent experiments with standard error of the mean.
Extended Data Figure 5
Extended Data Figure 5. Raw EM images of negative stained native T4L-β2V2R-βarr1-Fab 30(ScFv30) complex.
a) Raw EM image of T4L-β2V2R-βarr1-Fab30 complex.b) Raw EM image of T4L-β2V2R-βarr1-ScFv30 complex. Scale bar = 100 nm.
Extended Data Figure 6
Extended Data Figure 6. 2D classifications of the T4L-β2V2R-βarr1-Fab30(ScFv30) complex. Reference-free 2D class averages were obtained using ISAC.
a) 2D classification of the T4L-β2V2R -βarr1-Fab30 comple x. b) 2D classification of the T4L-β2V2R-βarr1-ScFv30 complex. Scale bar = 10 nm.
Extended Data Figure 7
Extended Data Figure 7. “On-column” glutaraldehyde cross-linking of the pre-formed complex.
a. Schematic representation of the “on-column” cross-linking strategy. A glutaraldehyde solution is injected to a size exclusion chromatography column, followed by injection of the purified complex protein. As the complex protein passes through the glutaraldehyde bolus, the receptor and the βarr components of the complex are cross-linked through proximal primary amine groups. This procedure allows only brief exposure of the complex to glutaraldehyde and serves as an “in-line” purification of homogenously cross-linked protein from any aggregation that may arise from non-specific cross-linking. b. “On-column” cross-linking of the T4L-β2V2R-βarr1-ScFv30 complex. Purified complex (approximately 20μM) was injected on to a 24mL Superdex 200 gel filtration column after a pre-injection of 200μL of 0.25% glutaraldehyde bolus. Individual fractions were collected and analyzed by “Simplyblue” stained SDS-PAGE. c. “On-column” cross-linking of the T4L-β2V2R-βarr1-Fab30 complex performed as described for the ScFv complex above.
Extended Data Figure 8
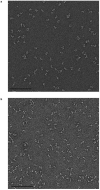
Extended Data Figure 8. Raw EM images of negative stained cross-linked T4L-β2V2R-β arr1-Fab30(ScFv30) complex.
a) Raw EM image of T4L-β2V2R-βarr1-Fab30 complex. b) Raw EM image of T4L-β2V2R-βarr1-ScFv30 complex. Scale bar = 100 nm.
Extended Data Figure 9
Extended Data Figure 9. 2D classifications of cross-linked T4L-β2V2R-βarr1-Fab30(ScFv30) complex.
Reference-free 2D class averages were obtained using ISAC. a) 2D classification of cross-linked T4L-β2V2R-βarr1-Fab30 complex. b) 2D classification of cross-linked T4L-β2V2R-βarr1- ScFv30 complex. Scale bar = 10 nm.
Extended Data Figure 10
Extended Data Figure 10. 3D EM reconstructions and resolution indications by Fourier Shell Correlation (FSC) curves.
The top panel shows the 3D map from particles representing the fully engaged β2V2R-βarr1 conformation of the T4L-β2V2R-βarr1- Fab30 complex. The bottom panel shows the 3D reconstruction from particles displaying the loose, hanging arrestin, conformation of the same complex. Representative 2D averages of particles used for the calculation of initial models by the random conical tilt method are shown on the left of each respective 3D map.

References

    1. Pierce KL, Lefkowitz RJ. Classical and new roles of beta-arrestins in the regulation of G-protein-coupled receptors. Nat Rev Neurosci. 2001;2:727–733. doi:10.1038/35094577. - PubMed
    1. Shukla AK, Xiao K, Lefkowitz RJ. Emerging paradigms of beta-arrestin dependent seven transmembrane receptor signaling. Trends Biochem Sci. 2011;36:457–469. doi:10.1016/j.tibs.2011.06.003. - PMC - PubMed
    1. Lefkowitz RJ, Shenoy SK. Transduction of receptor signals by beta-arrestins. Science. 2005;308:512–517. doi:10.1126/science.1109237. - PubMed
    1. Pierce KL, Premont RT, Lefkowitz RJ. Seven-transmembrane receptors. Nat Rev Mol Cell Biol. 2002;3:639–650. doi:10.1038/nrm908. - PubMed
    1. DeWire SM, Ahn S, Lefkowitz RJ, Shenoy SK. Beta-arrestins and cell signaling. Annu Rev Physiol. 2007;69:483–510. doi:10.1146/annurev.ph.69.013107.100021. - PubMed

Publication types

MeSH terms