. 2014 Sep 18;513(7518):436-9.
doi: 10.1038/nature13540. Epub 2014 Jul 16.

Endocrinization of FGF1 produces a neomorphic and potent insulin sensitizer

Affiliations

Endocrinization of FGF1 produces a neomorphic and potent insulin sensitizer

Jae Myoung Suh et al. Nature. .

Erratum in

Abstract

Fibroblast growth factor 1 (FGF1) is an autocrine/paracrine regulator whose binding to heparan sulphate proteoglycans effectively precludes its circulation. Although FGF1 is known as a mitogenic factor, FGF1 knockout mice develop insulin resistance when stressed by a high-fat diet, suggesting a potential role in nutrient homeostasis. Here we show that parenteral delivery of a single dose of recombinant FGF1 (rFGF1) results in potent, insulin-dependent lowering of glucose levels in diabetic mice that is dose-dependent but does not lead to hypoglycaemia. Chronic pharmacological treatment with rFGF1 increases insulin-dependent glucose uptake in skeletal muscle and suppresses the hepatic production of glucose to achieve whole-body insulin sensitization. The sustained glucose lowering and insulin sensitization attributed to rFGF1 are not accompanied by the side effects of weight gain, liver steatosis and bone loss associated with current insulin-sensitizing therapies. We also show that the glucose-lowering activity of FGF1 can be dissociated from its mitogenic activity and is mediated predominantly via FGF receptor 1 signalling. Thus we have uncovered an unexpected, neomorphic insulin-sensitizing action for exogenous non-mitogenic human FGF1 with therapeutic potential for the treatment of insulin resistance and type 2 diabetes.


Conflict of interest statement

The authors declare no competing financial interests.

Figures

Extended Data Fig. 1
Extended Data Fig. 1. Acute rFGF1 injection lowers blood glucose levels and reduces food intake
Blood glucose levels in ob/ob mice after (a) subcutaneous (sc, n=3), intraperitoneal (ip, n=3), (b) intravenous (iv) injection of rFGF1 (n=6) or control vehicle (n=5), or (c) sc injection of rFGF1 premixed with heparin (1.5 mg/kg, n=3). (d) Serum insulin levels 24 hrs after rFGF1 treatment under ad lib fed or fasting conditions in chow fed C57BL/6J mice (n=10). (e) Blood glucose levels in fasted, chow fed mice after rFGF1 treatment (n=8). (f) Food intake during 24 hrs post-injection of rFGF1 in chow fed C57BL/6J mice (n=8). Food intake during indicated times post-injection of rFGF1 in (g) ob/ob (n=6), (h) db/db (n=3), and (i) DIO (n=6) mice. Control PBS (open bar) or murine rFGF1 (0.5 mg/kg, filled bar) were injected sc to ad lib fed mice unless otherwise noted. Values are means ± SEM. Statistics by two-tailed t test. *P < 0.05, **P < 0.01
Extended Data Fig. 2
Extended Data Fig. 2. Chronic administration of rFGF1 lowers blood glucose independent of food intake and metabolic hormones
MRI analyses of (a) fat and (b) lean mass content at indicated days, and (c) food intake during chronic administration of control vehicle (n=6) or rFGF1 (n=8) in ob/ob mice. (d) Random fed blood glucose of a pair-fed cohort of ob/ob mice (red line, filled triangles) plotted alongside blood glucose trends during chronic administration of control vehicle (black line, open squares) or rFGF1 in ob/ob mice (black line, filled squares, n=6). Pair-fed cohort food intake was restricted to equal the food intake of rFGF1 injected ob/ob mice throughout the 5 week trial. (e) Serum cholesterol, (f) free fatty acids, and (g) metabolic hormone levels after 5 week administration of control PBS or rFGF1 in ob/ob mice (n=4). (h) Body weight, (i) tissue mass analyses, and (j) food intake of DIO mice after 4 weeks of rFGF1 treatment (n=6). All injections were performed sc with control vehicle (PBS, open bars or symbols) or murine rFGF1 (0.5 mg/kg, closed bars or symbols) to ad lib fed mice every 48 hrs throughout chronic administration trials. Values are means ± SEM. Statistics by two-tailed t test. *P < 0.05, **P < 0.01
Extended Data Fig. 3
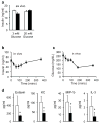
Extended Data Fig. 3. rFGF1 does not stimulate insulin secretion and chronic administration reduces systemic inflammation
(a) Glucose-stimulated insulin secretion (3 mM glucose, basal; 20 mM glucose, stimulated) of ob/ob islets after 1 hr pre-treatment with control PBS (open bars) or rFGF1 (10 ng/ml, filled bars, n=6). Time course of (b) serum insulin and (c) blood glucose levels in ob/ob mice after a single rFGF1 injection (0.2 mg/kg iv, n=8). (d) Serum cytokines in ob/ob mice after 5 week sc administration of control vehicle (PBS, open bars, n=4) or rFGF1 (0.5 mg/kg q.a.d., filled bars, n=6) Values are means ± SEM. Statistics by two-tailed t test. *P < 0.05, **P < 0.01
Extended Data Fig. 4
Extended Data Fig. 4. rFGF1 is an insulin sensitizer and does not affect bone morphology
(a) Steady state glucose infusion rate (GIR), (b) hepatic inflammation-related gene expression, (c) glucose tolerance tests, and (d) body weights of DIO mice after 3 weeks administration of control PBS (n=11) or rFGF1 (0.5 mg/kg, q.a.d., n=9). (e) Basal hepatic glucose production and (f) basal and clamped serum insulin concentrations measured during hyperinsulinemic–euglycemic clamp studies of DIO mice after 3 weeks administration of control PBS (n=11) or rFGF1 (n=9). (g) Insulin induced phosphorylation of Akt in liver and (h) muscle tissues of DIO mice after 3 weeks administration of control PBS (n=11) or rFGF1 (n=12) (i) Food intake, (j) carbon dioxide production, (k) heat production, (l) total activity, (m) respiratory exchange ratio (RER), and (n) oxygen consumption of chronic rFGF1-treated DIO mice (3 weeks treatment of control PBS (blue symbols) or rFGF1 (red symbols, n=4), measured in metabolic cages. (o) Representative hematoxylin and eosin staining of inguinal white adipose tissue from DIO mice after 4 weeks administration of control PBS or rFGF1 (n=6). (p) Serum creatine kinase levels in chronic rFGF1-treated ob/ob mice (n=4). (q) Bone mineral density and (r) trabecular bone thickness (Tb Th) and space (Tb Sp), and cortical bone thickness (C Th) in 4 week treated DIO mice analyzed by μ Computed Tomography (n=6). (s) Total and high molecular weight (HMW) serum adiponectin levels in ob/ob mice after 4 weeks of rFGF1 injections every 48 hrs (n=4). Control vehicle (PBS, open bar), rFGF1 (0.5 mg/kg sc, filled bars). Values are means ± SEM. Statistics by two-tailed t test. *P < 0.05, **P < 0.01, ***P < 0.005, ****P < 0.001
Extended Data Fig. 5
Extended Data Fig. 5. Binding affinities of rFGF1 and rFGF1ΔNT to FGFRs
Removal of the N-terminus from FGF1 reduces the ligand’s binding affinity for FGFRs. (a) Overlays of SPR sensorgrams of FGF1 binding to the ligand-binding domain of FGFRs and fitted saturation binding curves. Equilibrium dissociation constants (KDs) were derived from the saturation binding curves. (b) Overlays of SPR sensorgrams of FGF1ΔNT binding to the ligand-binding domain of FGFRs. Where possible, (KDs) were calculated from fitted saturation binding curves.
Extended Data Fig. 6
Extended Data Fig. 6. rFGF1 and rFGF1ΔNT signal through FGFR1 in a dose-dependent manner
(a) Western blot showing intracellular signaling in serum starved HEK293 cells after a 15 min treatment with the indicated concentrations of PBS, rFGF1ΔNT, or rFGF1. (b) Dose response of glucose lowering effects of sc delivered rFGF1ΔNT (striped bars) in comparison to rFGF1 (filled bars) in 12 week old ob/ob mice (n=8). (c) Food intake in DIO mice during 24 hr period after injection of control PBS (open bar), rFGF1 (0.5 mg/kg sc, filled bars), or rFGF1ΔNT (0.5 mg/kg sc, striped bar, n=10). (d) Blood glucose levels in high-fat diet fed (8 mos) Fgfr1 fl/fl (WT, n=5) and aP2-Cre; Fgfr1 fl/fl (R1 KO, n=4) mice at 0 (open bars) and 24 hrs (filled bars) after rFGF1ΔNT treatment (0.5 mg/kg sc). (e) Western blot showing intracellular signaling in serum starved HEK293 cells after a 15 min treatment with of PBS or 10ng/ml of rFGF1, two independent preparations of rFGF1ΔNT, and rFGF1ΔNT2. (f) Blood glucose levels in ob/ob mice at 0 (open bars) and 24 hrs (filled bars) after rFGF1ΔNT and rFGF1ΔNT2 treatment (0.5 mg/kg sc)(n=2). Gel images are representative of at least 3 biological replicates. Values are means ± SEM. Statistics by two-tailed t test. *P<0.05, ***P < 0.005
Fig. 1
Fig. 1. Acute rFGF1 injection lowers glucose in diabetic mice
(a) Blood glucose levels in ob/ob mice after rFGF1 (closed symbol, n=6) or control vehicle (open symbol, n=4) injection. (b) Dose response of rFGF1 on blood glucose levels in ob/ob mice 24 h post-injection (n=3). Blood glucose levels after rFGF1 injection in (c) db/db (n=3), (d) diet induced obesity (DIO) (n=6), (e) chow fed (n=8), and (f) fasted ob/ob (control n=6, rFGF1 n=5) mice. (g) Blood glucose levels in ob/ob mice before (open bars) and 24 h after (closed bars) injection of murine FGF peptides (n=4), and (h) human rFGF1 (n=4). Recombinant FGF peptides (0.5 mg/kg) or control vehicle (PBS) were subcutaneously (sc) injected to ad lib fed mice unless otherwise noted. Values are means ± SEM. Statistics by two-tailed t test. *P < 0.05, **P < 0.01.
Fig. 2
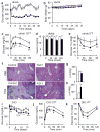
Fig. 2. Chronic rFGF1 administration achieves sustained glucose lowering and insulin sensitization in diabetic mice
(a) Random fed blood glucose and (b) body weight during chronic rFGF1 treatment. (c) glucose tolerance test (GTT), (d) insulin levels during GTT, and (e) insulin tolerance test (ITT) measured in ob/ob mice after 4 weeks rFGF1 treatment (control n=6, rFGF1 n= 8). (f) Representative hematoxylin and eosin (H&E) and periodic acid-schiff staining (PAS, magenta represents glycogen), (g) triglyceride, and (h) glycogen content of ob/ob livers after 5 weeks chronic rFGF1 treatment (overnight fasted, control n=6, rFGF1 n= 8). (i) Random fed blood glucose, (j) GTT and (k) ITT in DIO mice after 3 weeks rFGF1 treatment (n=6). Ad lib fed mice were injected sc with 0.5 mg/kg rFGF1 (filled bars) or control vehicle (PBS open bars) every 48 hrs. Values are means ± SEM. Statistics by two-tailed t test. *P < 0.05, **P < 0.01, ***P < 0.005
Fig. 3
Fig. 3. rFGF1 induces insulin-dependent glucose uptake
(a) Blood glucose levels in STZ-induced diabetic mice 8 hrs after sc injection of control PBS (open bars) or rFGF1 (0.5 mg/kg, filled bars). (b) ITT and (c) area under the ITT curve of control- and rFGF1-treated STZ mice (open and closed symbols, respectively, n=4). Ob/ob blood glucose level and metabolic clearance rate (MCR) after control PBS (open bar) or rFGF1 injection (0.2 mg/kg iv, filled bar) before (d, f) or 1 hr after (e, g) somatostatin infusion (n=5). Values are means ± SD. Statistics by two-tailed t test. *P < 0.05, **P < 0.01
Fig. 4
Fig. 4. Chronic rFGF1 administration is insulin sensitizing
(a) Insulin-stimulated hepatic glucose suppression, (b) steady state glucose disposal rate (GDR), and (c) insulin-stimulated glucose disposal rate (IS-GDR) measured during hyperinsulinemic–euglycemic clamps on DIO mice after 3 weeks control PBS (open bars n=11) or rFGF1(0.5mg/kg sc q.a.d., closed bars n=9) treatment. (d) Proliferative activity of NIH3T3 cells treated with rFGF1 or rFGF1ΔNT at the indicated concentrations (experiment repeated 3 times). (e) Blood glucose levels of ob/ob mice treated with control PBS (open symbols n=12), rFGF1 (0.5 mg/kg sc, filled symbols, n=8), or rFGF1ΔNT (0.5 mg/kg sc, dashed line, n=6). (f) Blood glucose levels of DIO mice treated with control PBS (open bars), rFGF1 (0.5 mg/kg sc, filled bars), or rFGF1ΔNT (0.5 mg/kg sc, striped bars) at indicated times (n=10). (g) Blood glucose levels in high-fat diet fed (8 months) Fgfr1 fl/fl (WT, n=5) and aP2-Cre; Fgfr1 fl/fl (R1 KO, n=4) mice at 0 (open bars) and 24 hrs (filled bars) after rFGF1 treatment (0.5 mg/kg sc). Values are means ± SEM. Statistics by two-tailed t test. *P < 0.05, **P < 0.01, ***P < 0.005

Comment in

References

    1. Beenken A, Mohammadi M. The FGF family: biology, pathophysiology and therapy. Nat Rev Drug Discov. 2009;8:235–253. - PMC - PubMed
    1. Itoh N, Ornitz DM. Fibroblast growth factors: from molecular evolution to roles in development, metabolism and disease. J Biochem. 2011;149:121–130. - PMC - PubMed
    1. Jonker JW, et al. A PPARgamma-FGF1 axis is required for adaptive adipose remodelling and metabolic homeostasis. Nature. 2012;485:391–394. - PMC - PubMed
    1. Sun K, Scherer PE. The PPARgamma-FGF1 axis: an unexpected mediator of adipose tissue homeostasis. Cell Res. 2012 - PMC - PubMed
    1. Lehrke M, Lazar MA. The many faces of PPARgamma. Cell. 2005;123:993–999. - PubMed

Publication types

MeSH terms