. 2014 Sep;76(3):379-92.
doi: 10.1002/ana.24219. Epub 2014 Jul 29.

PLXNA4 is associated with Alzheimer disease and modulates tau phosphorylation

Affiliations

PLXNA4 is associated with Alzheimer disease and modulates tau phosphorylation

Gyungah Jun et al. Ann Neurol. 2014 Sep.

Abstract

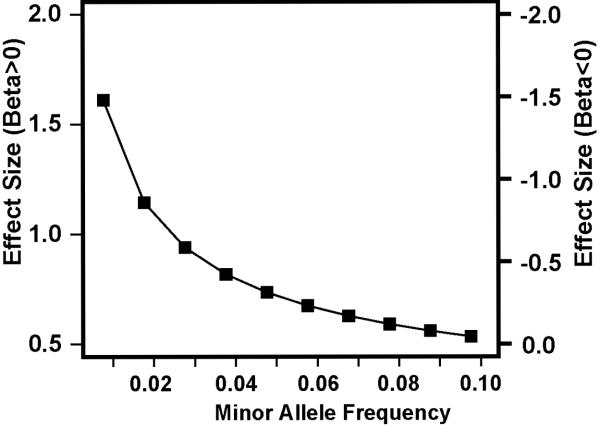
Objective: Much of the genetic basis for Alzheimer disease (AD) is unexplained. We sought to identify novel AD loci using a unique family-based approach that can detect robust associations with infrequent variants (minor allele frequency < 0.10).

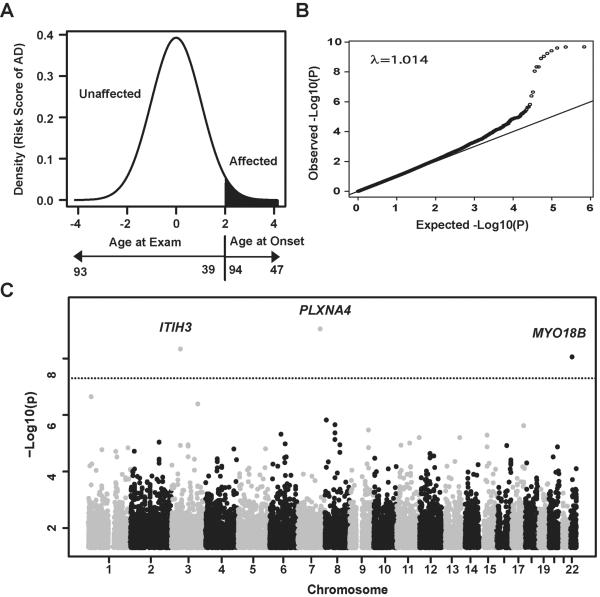
Methods: We conducted a genome-wide association study in the Framingham Heart Study (discovery) and NIA-LOAD (National Institute on Aging-Late-Onset Alzheimer Disease) Study (replication) family-based cohorts using an approach that accounts for family structure and calculates a risk score for AD as the outcome. Links between the most promising gene candidate and AD pathogenesis were explored in silico as well as experimentally in cell-based models and in human brain.

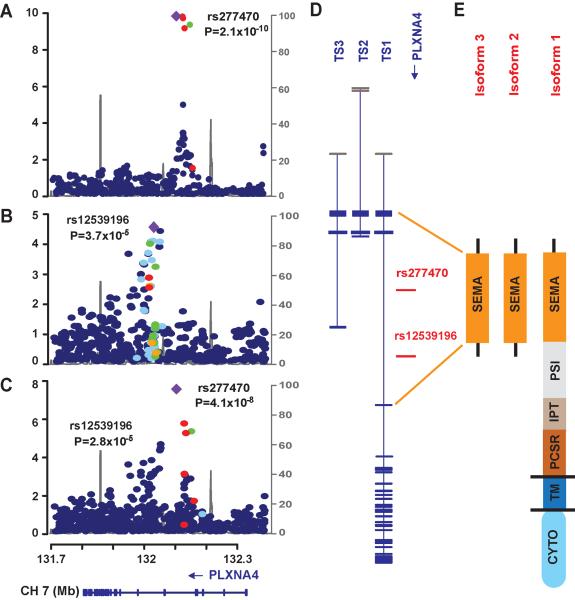
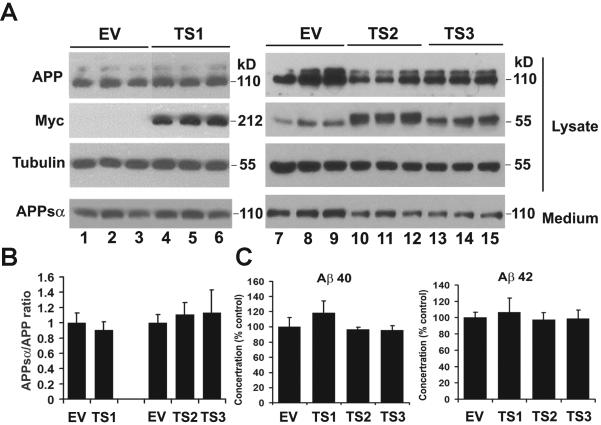
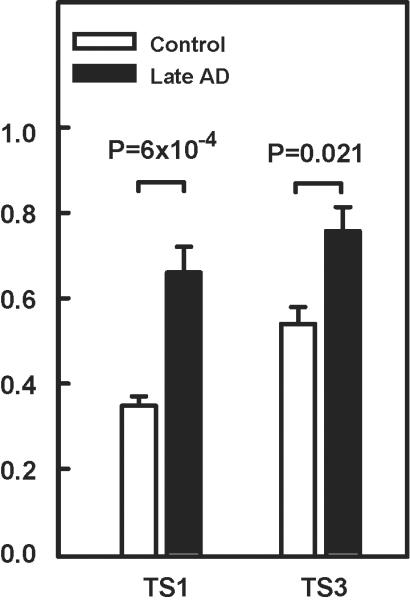
Results: Genome-wide significant association was identified with a PLXNA4 single nucleotide polymorphism (rs277470) located in a region encoding the semaphorin-3A (SEMA3A) binding domain (meta-analysis p value [meta-P] = 4.1 × 10(-8) ). A test for association with the entire region was also significant (meta-P = 3.2 × 10(-4) ). Transfection of SH-SY5Y cells or primary rat neurons with full-length PLXNA4 (TS1) increased tau phosphorylation with stimulated by SEMA3A. The opposite effect was observed when cells were transfected with shorter isoforms (TS2 and TS3). However, transfection of any isoform into HEK293 cells stably expressing amyloid β (Aβ) precursor protein (APP) did not result in differential effects on APP processing or Aβ production. Late stage AD cases (n = 9) compared to controls (n = 5) had 1.9-fold increased expression of TS1 in cortical brain tissue (p = 1.6 × 10(-4) ). Expression of TS1 was significantly correlated with the Clinical Dementia Rating score (ρ = 0.75, p = 2.2 × 10(-4) ), plaque density (ρ = 0.56, p = 0.01), and Braak stage (ρ = 0.54, p = 0.02).

Interpretation: Our results indicate that PLXNA4 has a role in AD pathogenesis through isoform-specific effects on tau phosphorylation.


Figures

Fig 1
Fig 1. Genome-wide association analysis in the Framingham Heart Study
(A) Ranked risk score distribution. Liability scores after adjusting for age and sex in a logistic regression model were rank-transformed and analyzed as a quantitative trait. Areas with red indicate distribution of risk (liability) rank of AD cases based on age at onset. Black arrow for age at exam from controls and red arrow for age at onset from AD cases indicate ranks of risk scores. The curve shows younger unaffected subjects have higher risk to develop AD than older unaffected subjects, and AD cases with earlier onset have greater liability than cases with older onset. (B) Quantile-quantile plot. Observed P values (Y-axis) were plotted against expected P values (X-axis). Black dots represent P values for all genotyped SNPs. (C) Manhattan plot. Association results for genotyped SNPs. P-values are expressed as −log10(P) (y-axis) for every tested SNP ordered by chromosomal location (x-axis). Genome-wide significance level is shown as a dotted line at P=1.4×10⁻⁷.
Fig 2
Fig 2. Power to detect genome-wide significant association with AD in the Framingham Heart Study
Effect sizes (i.e., beta estimates in the regression model) to obtain 80% power for infrequent SNPs (0.01 ≤ minor allele frequency [MAF] ≤ 0.1) under the additive model were estimated using a sibling correlation of 0.199 in 2,779 relative pairs at the genome-wide significance level. Effect size of the SNP on AD risk (Y-axis) according to MAF (X-axis) was computed for rank-transformed liability scores. The power estimates are conservative because they account for only sib-pair relationships in the pedigree.
Fig 3
Fig 3. Genetic findings in the PLXNA4 region
Regional association plots of genotyped and imputed SNPs from the FHS (A) and NIA-LOAD (B) datasets, and in meta-analysis (C). Most significant SNPs in the FHS (rs277470) and NIA-LOAD (rs12539196) datasets are indicated by purple diamonds. P-values are expressed as −log10(P) (y-axis) for every tested SNP ordered by chromosomal location (x-axis). Estimates of linkage disequilibrium (r2) of SNPs in this region with the top SNP computed using 1000 Genomes (hg19/Nov2010EUR) are shown as orange circles for r2 ≥ 0.8, yellow circles for 0.5 ≤ r2 < 0.8, light blue circles for 0.2 ≤ r2 < 0.5, and blue circles for r2 < 0.2. Recombination rates (scale on right axis) are plotted with a solid gray line. Genomic structure of PLXNA4 was determined using the NCBI database (Build 37.1). (D) Relative position of the most significantly associated SNPs in FHS and NIA-LOAD datasets in the three validated transcripts (TS1, TS2, and TS3). Exons are denoted with horizontal bars. (E) Diagrams of functional domains encoded by amino acids from the full-length (TS1) and the shorter (TS2 and TS3) transcripts. SEMA: sema_plexinA1 interacting module (exon 1–4 in TS1 and exon 1–3 in TS2 and TS3); PSI: plexin repeat (exon 4–11 in TS1); IPT: three repeats of the binding domains of plexins and cell surface receptors (exon 11–17 n TS1); PCSR: binding domain of plexins and cell surface receptors (PCSR) and related proteins (exon 17–19 in TS1); TM: transmembrane region (exon 19 in TS1); CYTO: cytoplasmic domain (exon 20–31 in TS1).
Fig 4
Fig 4. Linkage disequilibrium (LD, D') of top ranked SNPs
LD was calculated in 1000 Genomes data from (A) Caucasians (CEU), (B) African Americans (AA), and (C) Asians (ASN). Top-ranked SNPs from PLXNA4 from each dataset are shown, namely rs277470, rs277472, and rs277484 in FHS; rs12539196 in NIA-LOAD, rs10273901 in ADGC Caucasians (ADGC-EA), rs75460865 in ADGC African Americans (ADGC-AA), and rs13232207 in ADGC Japanese (ADGC-JPN). The top SNP in the ADGC-AA dataset was monomorphic in both CEU and ASN populations. Five top-ranked SNPs (rs10273901, rs75460865, rs277470, rs277472, and rs277484) from the ADGC-EA and ADGC-AA samples were monomorphic in the ASN population. The top ranked SNPs are located in the SEMA domain, except rs10273901 and rs13232207 which are located in the cytoplasmic domain.
Fig 5
Fig 5. Effect of expression of the full-length PLXNA4 isoforms (TS1, TS2 and TS3) on APP processing
HEK293 cells stably overexpressing APP were transiently transfected with empty vector control (EV) or with the full-length (TS1) or one of the shorter isoforms (TS2 and TS3) of PLXNA4-Myc. 48 hrs after transfection, the conditioned medium (medium) and the cell lysates (lysate) were collected and analyzed by SDS-PAGE and western blotting using mAb 6E10 for total APP and APPsα, Myc mAb for all 3 isoforms of PLXNA4, and tubulin as control (A). The endogenous myc can be seen in all lanes at ~55 kDa but more clearly in lanes 7–9 where only empty vector was transfected but not PLXNA4-myc. Also note that TS1 migrates at 212kDa, TS2 migrates at 58kDa and TS3 migrates at 55kDa. (B) Densitometric analysis of the expression of APPsα normalized to total APP. Error bars indicate standard deviation. (C) ELISA analysis of Aβ40 and Aβ42 released to the medium. ELISAs were carried out using the human Aβ40 and Aβ42 ELISA kits (Invitrogen) in accordance with manufacturer's protocol. Error bars indicate standard deviation. Representative results of three independent experiments are shown in each panel.
Fig 6
Fig 6. Effect of PLXNA4 isoforms on tau phosphorylation
(A) SH-SY5Y P301L cells were transfected with the full-length (TS1) or one of the shorter isoforms (TS2 and TS3) of PLXNA4-Myc or empty vectors (pcDNA3.1) with or without 3nM SEMA3A stimulation for 1hr. Whole cell lysates were blotted with AT8, total tau, actin and Myc. Results for the TS2 and TS3 isoforms were similar but ony those for TS3 are shown. (B) 6x His-tagged SEMA3A-Fc was precipitated from media by Protein A/G agarose, and the precipitates were immunoblotted with antibodies to Myc (detecting PLXNA4 isoforms) and 6x His (detecting SEMA3A-FC). (C) E18 rat primary hippocampal neurons were cultured for 14 days and stimulated with 3nM SEMA3A for 1 hr, and co-stained with anti-β3-tubulin (B3T) mouse monoclonal (1:500, green) and anti-pT514 CRMP2 rabbit polyclonal (1:500, red). (D) Rat primary hippocampal neurons were transfected with the full-length or short isoforms of Plexin-A4-Myc. After transfection, cells were treated with or without 3 nM Sema3A for 1-hr, and co-stained with AT8 (1:500) and anti-Myc (rabbit polyclonal, 1:200, Covance Inc). AT8 signals were digitally captured and quantified as previously reported (Uchida et al., 2005). Cells are immunostained with anti-Myc (green) and AT8 (red). Scale bar represents 10 μm. * P<0.05, ** P<0.01, and *** P<0.001, as determined by ANOVA and Tukey post hoc.
Fig 7
Fig 7. Expression of PLXNA4 isoforms in postmortem brains
Expression of PLXNA4 isoforms from Broadmann area 9 of frozen post-mortem brain tissue specimens were compared in controls and late-stage AD cases using primer sets to detect full-length (TS1) and short (TS3) isoforms. RNA expression level (Y-axis) shown is the normalized value. P-values were determined by T-test accounting for unequal variances.

References

    1. Thies W, Bleiler L. 2011 Alzheimer's disease facts and figures. Alzheimers Dement. 2011 Mar;7(2):208–44. - PubMed
    1. Farrer LA. Genetics and the dementia patient. Neurologist. 1997;3:13–30.
    1. Farrer LA, Cupples LA, Haines JL, et al. Effects of age, sex, and ethnicity on the association between apolipoprotein E genotype and Alzheimer disease. A meta-analysis. APOE and Alzheimer Disease Meta Analysis Consortium. Jama. 1997 Oct 22–29;278(16):1349–56. - PubMed
    1. Lambert JC, Ibrahim-Verbaas CA, Harold D, et al. Meta-analysis of 74,046 individuals identifies 11 new susceptibility loci for Alzheimer's disease. Nat Genet. 2013 Dec;45(12):1452–8. - PMC - PubMed
    1. Lill CM, Bertram L. Towards unveiling the genetics of neurodegenerative diseases. Semin Neurol. 2012 Nov;31(5):531–41. - PubMed

Publication types

MeSH terms