. 2014 Oct;44(10):2925-37.
doi: 10.1002/eji.201344305. Epub 2014 Aug 11.

Independent evolution of Fc- and Fab-mediated HIV-1-specific antiviral antibody activity following acute infection

Affiliations

Independent evolution of Fc- and Fab-mediated HIV-1-specific antiviral antibody activity following acute infection

Anne-Sophie Dugast et al. Eur J Immunol. 2014 Oct.

Abstract

Fc-related antibody activities, such as antibody-dependent cellular cytotoxicity (ADCC), or more broadly, antibody-mediated cellular viral inhibition (ADCVI), play a role in curbing early SIV viral replication, are enriched in human long-term infected nonprogressors, and could potentially contribute to protection from infection. However, little is known about the mechanism by which such humoral immune responses are naturally induced following infection. Here, we focused on the early evolution of the functional antibody response, largely driven by the Fc portion of the antibody, in the context of the evolving binding and neutralizing antibody response, which is driven mainly by the antibody-binding fragment (Fab). We show that ADCVI/ADCC-inducing responses in humans are rapidly generated following acute HIV-1 infection, peak at approximately 6 months postinfection, but decay rapidly in the setting of persistent immune activation, as Fab-related activities persistently increase. Moreover, the loss of Fc activity occurred in synchrony with a loss of HIV-specific IgG3 responses. Our data strongly suggest that Fc- and Fab-related antibody functions are modulated in a distinct manner following acute HIV infection. Vaccination strategies intended to optimally induce both sets of antiviral antibody activities may, therefore, require a fine tuning of the inflammatory response.

Keywords: ADCC; Antibodies; HIV; IgG3.


Conflict of interest statement

Conflict of interest

All the authors declare no financial or commercial conflict of interest.

Figures

Figure 1
Figure 1. Rapid induction of ADCVI/ADCC-inducing antibody responses in acute HIV-1 infection that predict viral set point
(A) A Spearman rank correlation was used to analyze the relationship between ADCC 1/EC50 levels and ADCC activity measured at 20 μg/mL in a group of 20 acutely infected individuals, 113 controllers, and 84 chronically infected individuals. (B–D) The innate immune antiviral activity of antibodies was assessed using (B) an ADCVI assay and (C) an NK-cell degranulation/cytokine secretion assay, which measured NK-cell activation via (i) CD107a release, (ii) IFN-γ secretion, (iii) TNF-α secretion, and (D) polyfunctional NK-cell activation observed in 11 acutely infected subjects 4 months post-infection compared with antibodies from 10 chronically infected patients. An ANOVA with a post-hoc Tukey’s test was used to test for differences in the ADCVI/ADCC responses between acutely and chronically infected individuals (*p<0.05, **p<0.005, ***p<0.0005). (E–G) Acutely infected individuals were divided into groups with set point viral loads that were either below or above the highest interquartile range (<3 × 10⁴) and ADCVI responses were measured. (E) The magnitude of the early ADCVI response, (F) the percent of antibody-induced NK-cell degranulation, and (G) the degree of antibody-induced polyfunctional NK-cell activity at 4 months post-infection were all determined for 5 individuals with viral loads below the highest interquartile range, and 5 individuals above the highest interquartile range. (B–G) Data are shown as median and interquartile range. Box plots represent the 25th percentile (lower edge of the box) and 75th percentile (upper edge of the box) of the ADCVI or ADCC responses per individual. (ANOVA with a post-hoc Tukey’s test; *p<0.05).
Figure 2
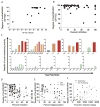
Figure 2. Independent evolution of Fab- and Fc-related antibody functions
(A–D) The ADCVI (A, and red line in C and D) and ADCC (B, and black line in C and D) activity were measured over the course of infection and compared between individuals who have (full circles) or lack (open squares) broadly neutralizing antibody responses (> or < 50% of reduction in HIV-1 entry at a 1:20 plasma dilution, respectively). In addition, anti-gp120 antibody titers were measured over time (blue line) in a representative individual (C) or a subset of 9 individuals (D). The relationship between ADCVI and ADCC activities and the duration of infection was tested using a Spearman rank correlation test (p<0.05).
Figure 3
Figure 3. The induction of neutralizing antibodies increases over the course of infection and correlates with the loss of ADCVI/ADCC
(A, B) The relationship between neutralizing antibody activity against a Tier 1 virus, SF162, was compared with (A) gp120 SF162 binding antibody titers measured by ELISA and (B) percent inhibition by ADCVI in all 11 patients using a Spearman rank correlation test. (C) The breadth of cross-neutralizing activity against a panel of 20 viruses over time was measured using the Tzm-bl cell–based pseudovirus neutralization assay. Each graph represents a single patient. The blue bars indicate no neutralization breadth (<20%), the green bars indicate low-level breath (20–40%), the orange bars indicate moderate breadth (40–70%), and the red bars indicate broad neutralization (>70%). The upper graphs represent patients who develop broadly neutralizing antibody responses; the lower graphs represent the majority of patients who did not develop such responses, as previously reported [6]. (D, E) The relationship between neutralizing antibody activity against Tier 2 viruses JRFL and TRO.11 was compared to (D) percent inhibition by ADCVI and (E) ADCC activity in the same patients. Trend lines (hatched lines) show that there is an inverse correlation between neutralization and ADCVI/ADCC activity using a Spearman rank correlation test. (F) The relationship between neutralization breadth and infection time among all study subjects, divided between those that induce moderate-to-high neutralization breadth (black line) and those that do not (grey line) was compared using a Spearman rank correlation test.
Figure 4
Figure 4. Loss of ADCVI/ADCC activity correlates with increasing immune activation
The relationship between inflammatory cytokine levels, including B-cell–activating cytokines (A) BAFF and (B) APRIL and ADCVI activity throughout the study period was analyzed by Spearman Rank test. (C, D) The relationship between the (C) ADCVI or (D) ADCC activity and a marker of immune activation, CD38 expression on CD8+ T cells, was examined in a subgroup of individuals (n=8). Box plots represent the 25th percentile (lower edge of the box) and 75th percentile (upper edge of the box) of the ADCVI or ADCC responses per individual, and error bars represent the range of the ADCVI or ADCC responses (y axis) and the expression level of CD38 on their CD8+ T cells (x axis). The data represent an average of flow cytometric analysis of eight separate experiments.
Figure 5
Figure 5. The emergence and evolution of hypergammaglobulinemia (HGG) occurs in three waves and is responsible for dampening ADCVI
The evolution of HGG was evaluated over time. (A) HGG was measured by ELISA in 6 individual subjects for 500 days post infection and shown as a total immunoglobulin (Ig) level in ng/uL. (B) A curve fit analysis was performed and shows the median of the Ig level in all 6 individuals, dividing the HGG evolution in three waves, phase 1 (antibody levels in the first 6 months of infection), phase 2 (slow rate in the following 6 months) and phase 3 (plateau 1 year post-infection). (C) The percent viral inhibition observed with various ratios of ADCVI-inducing antibodies to HIV-specific (HIVIG), and HIV-non-specific (IVIG) antibodies was measured by p24 ELISA and shown as a mean of 3 samples.
Figure 6
Figure 6. Loss of HIV-specific IgG3 responses occurs in parallel to a decline in ADCVI starting in acute infection
(A) The heat map depicts the correlations between epitope-specific antibody subclass levels at different time points following acute infection relative to the first time point, where red represents an increase and blue represents a loss of abundance. (B) The evolution of the HIV-specific IgG3 response in four representative individuals demonstrating different kinetics of IgG3 decay was measured by multiplex bead array and represented as a ratio of HIV-specific IgG3 levels over total HIV-specific IgG levels. (C) HIV-specific IgG3 titers were measured by multiplex bead array, depicted as mean fluorescence intensity (MFI) and correlated with ADCVI during progressive infection. The correlation was performed with Spearman rank test.

References

    1. Tomaras GD, Yates NL, Liu P, Qin L, Fouda GG, Chavez LL, Decamp AC, et al. Initial B-cell responses to transmitted human immunodeficiency virus type 1: virion-binding immunoglobulin M (IgM) and IgG antibodies followed by plasma anti-gp41 antibodies with ineffective control of initial viremia. J Virol. 2008;82:12449–12463. - PMC - PubMed
    1. Richman DD, Wrin T, Little SJ, Petropoulos CJ. Rapid evolution of the neutralizing antibody response to HIV type 1 infection. Proc Natl Acad Sci U S A. 2003;100:4144–4149. - PMC - PubMed
    1. Wei X, Decker JM, Wang S, Hui H, Kappes JC, Wu X, Salazar-Gonzalez JF, et al. Antibody neutralization and escape by HIV-1. Nature. 2003;422:307–312. - PubMed
    1. Doria-Rose NA, Klein RM, Manion MM, O’Dell S, Phogat A, Chakrabarti B, Hallahan CW, et al. Frequency and phenotype of human immunodeficiency virus envelope-specific B cells from patients with broadly cross-neutralizing antibodies. J Virol. 2009;83:188–199. - PMC - PubMed
    1. Sather DN, Armann J, Ching LK, Mavrantoni A, Sellhorn G, Caldwell Z, Yu X, et al. Factors associated with the development of cross-reactive neutralizing antibodies during human immunodeficiency virus type 1 infection. J Virol. 2009;83:757–769. - PMC - PubMed

Publication types

MeSH terms

Substances

LinkOut - more resources