. 2014 Dec 1;522(17):3861-84.
doi: 10.1002/cne.23646. Epub 2014 Jul 30.

Dynamics of nascent and active zone ultrastructure as synapses enlarge during long-term potentiation in mature hippocampus

Affiliations

Dynamics of nascent and active zone ultrastructure as synapses enlarge during long-term potentiation in mature hippocampus

Maria Elizabeth Bell et al. J Comp Neurol. .

Abstract

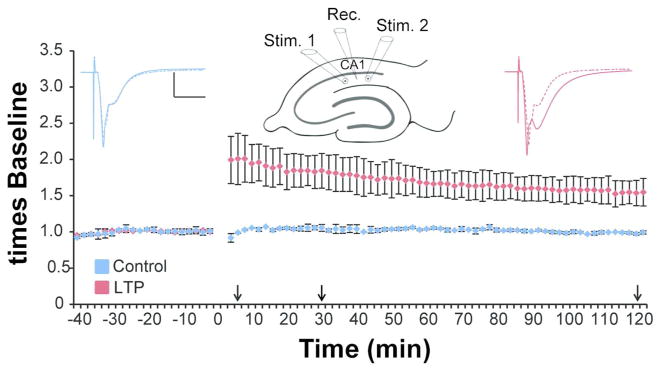
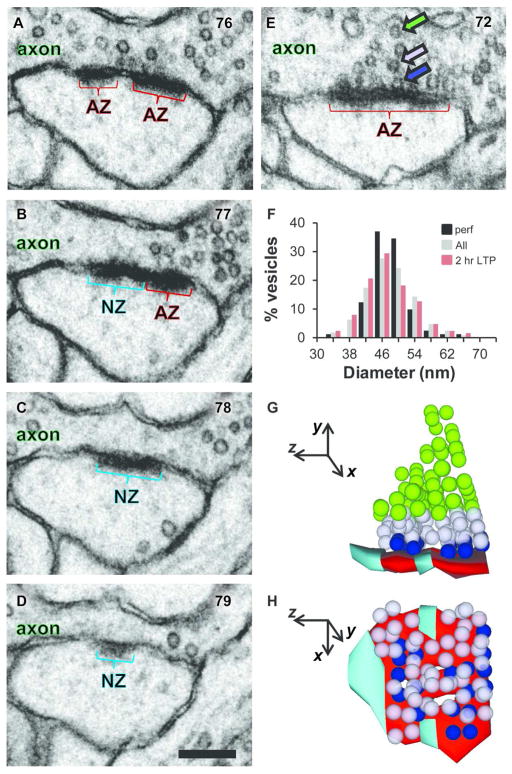
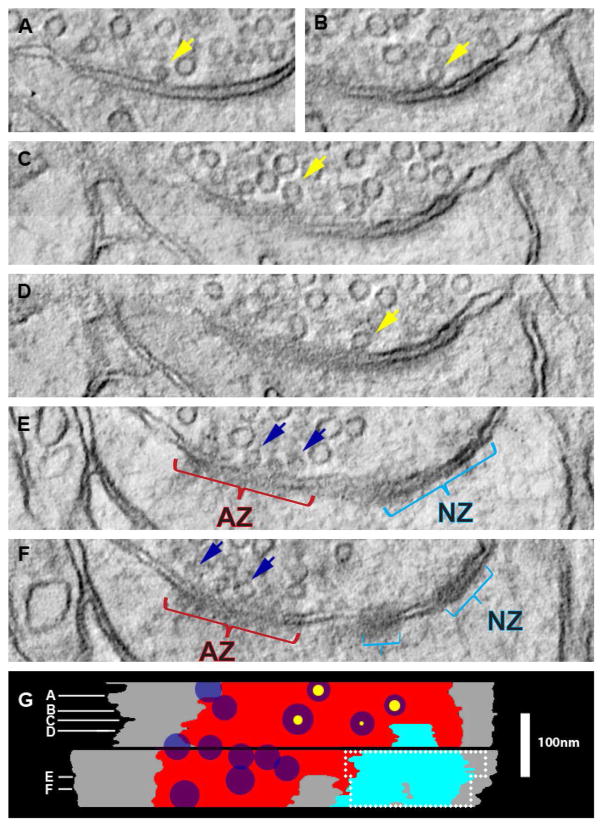
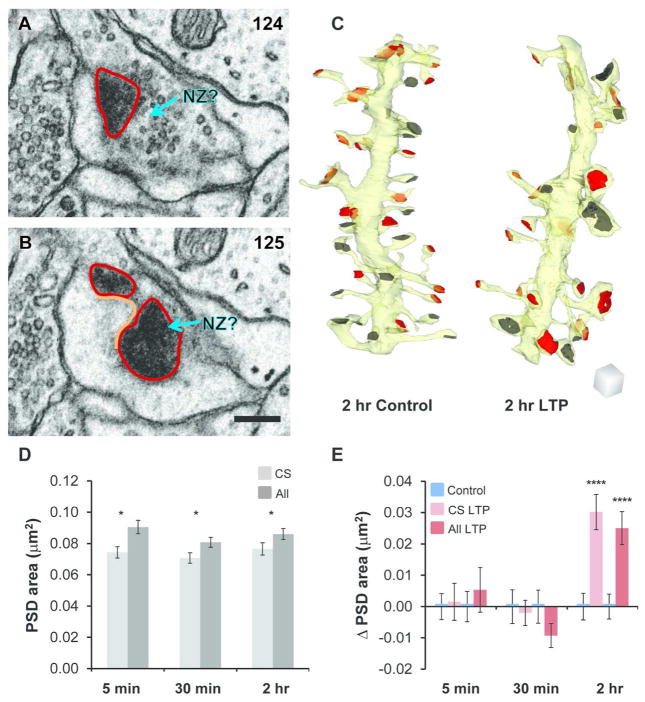
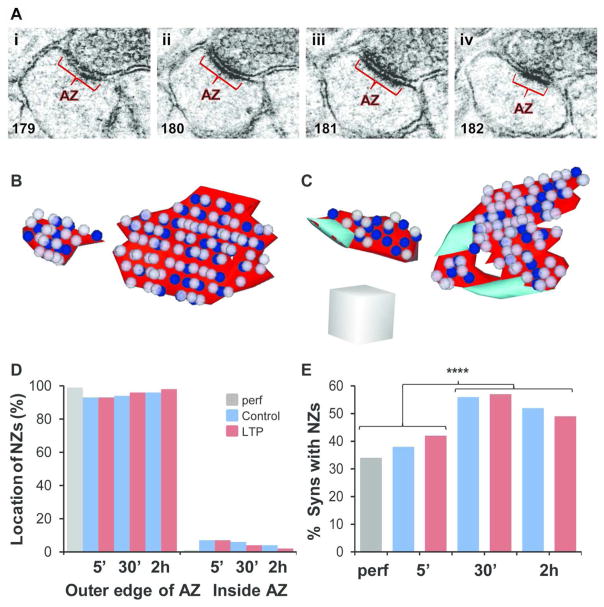
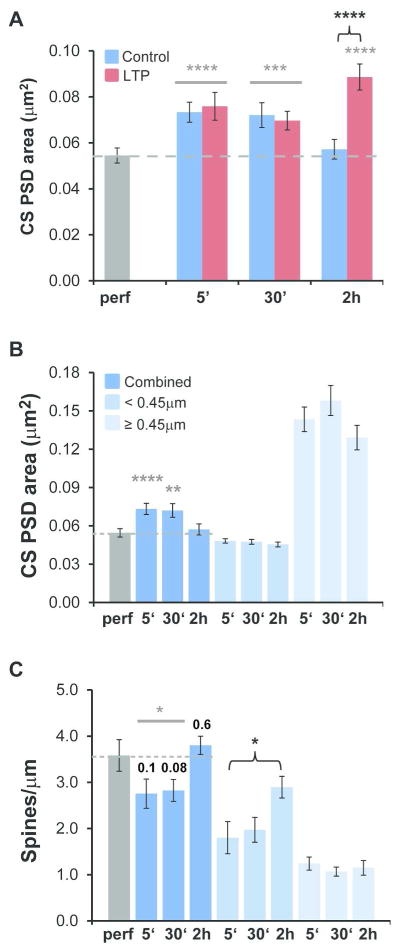
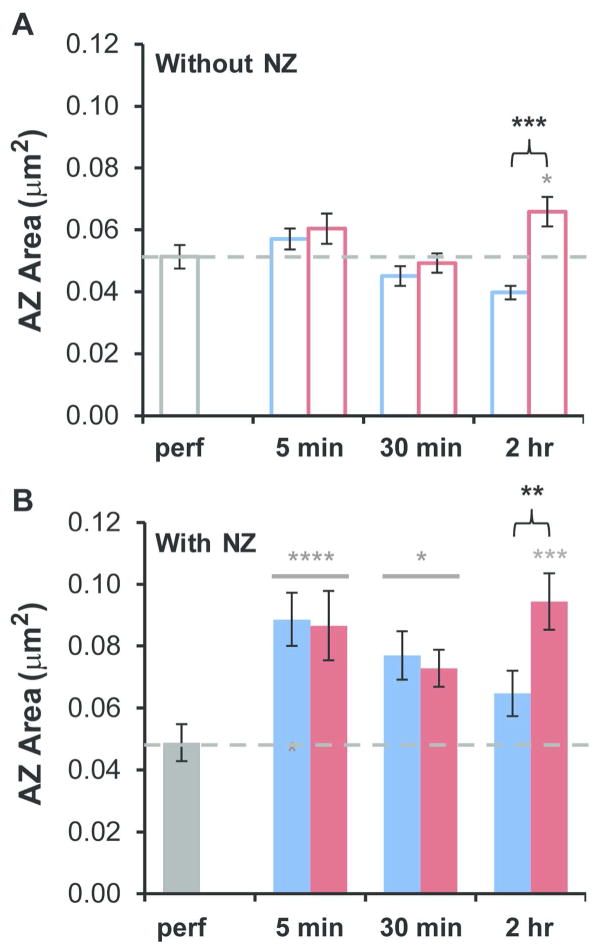
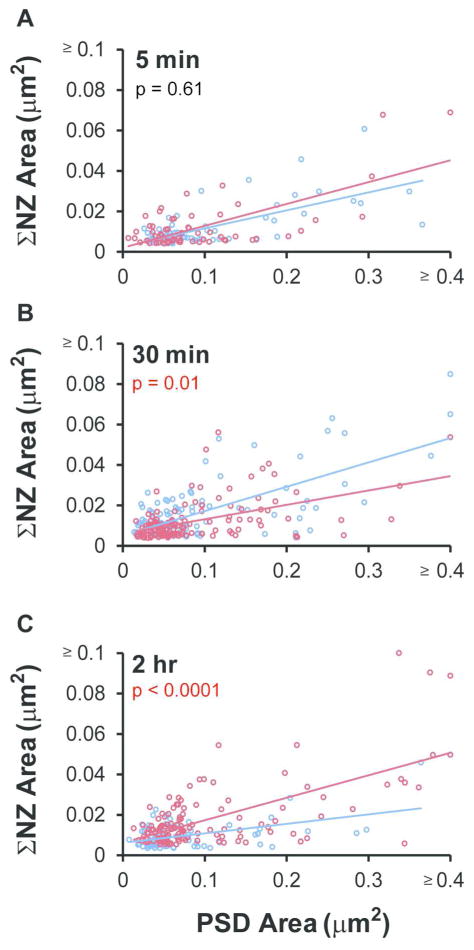
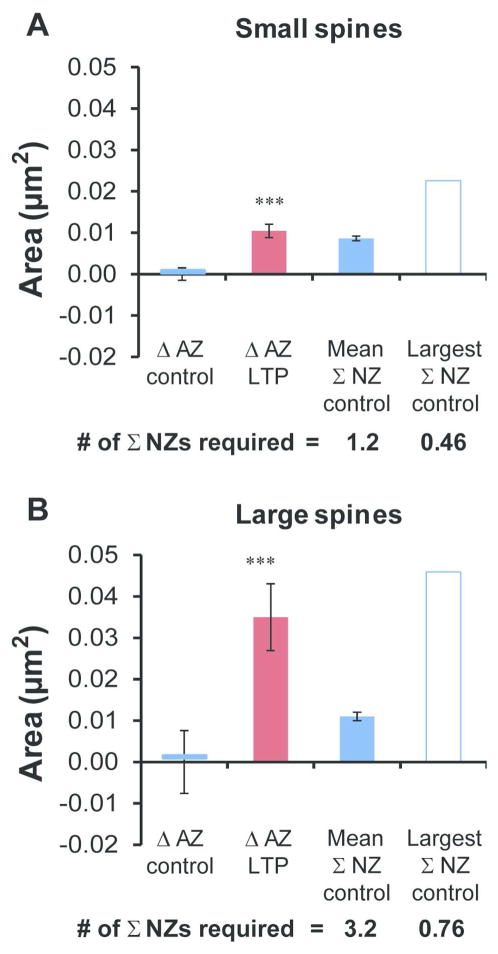
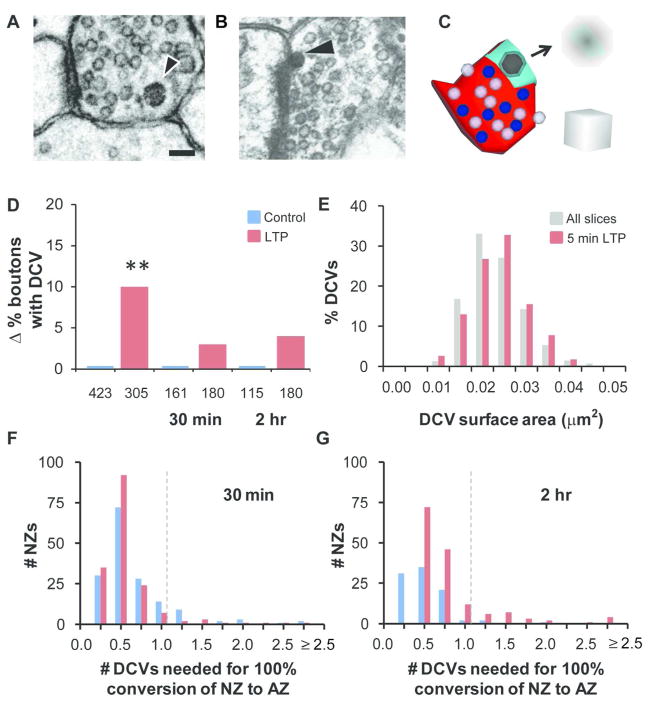
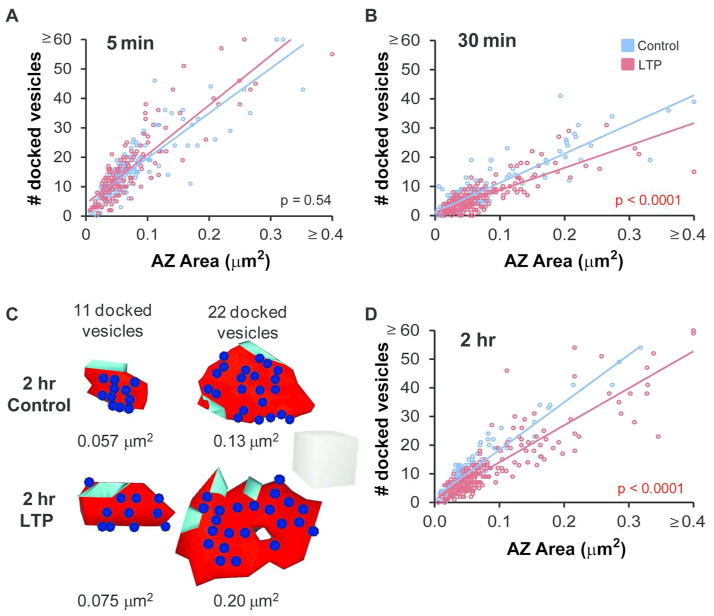
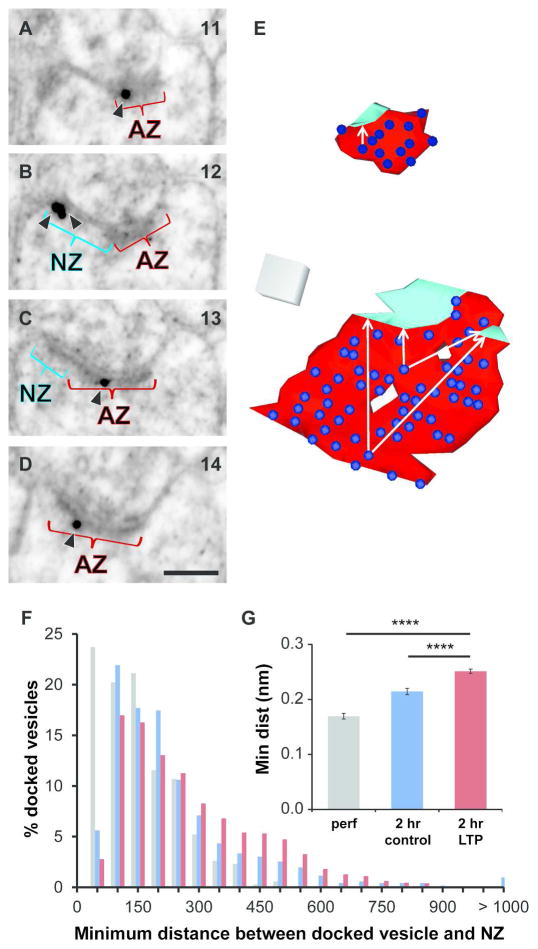
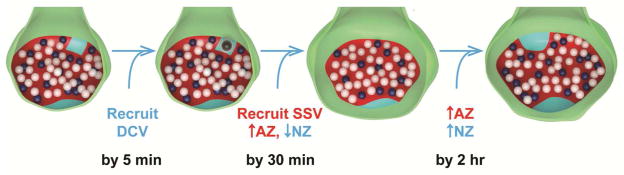
Nascent zones and active zones are adjacent synaptic regions that share a postsynaptic density, but nascent zones lack the presynaptic vesicles found at active zones. Here dendritic spine synapses were reconstructed through serial section electron microscopy (3DEM) and EM tomography to investigate nascent zone dynamics during long-term potentiation (LTP) in mature rat hippocampus. LTP was induced with theta-burst stimulation, and comparisons were made with control stimulation in the same hippocampal slices at 5 minutes, 30 minutes, and 2 hours post-induction and to perfusion-fixed hippocampus in vivo. Nascent zones were present at the edges of ∼35% of synapses in perfusion-fixed hippocampus and as many as ∼50% of synapses in some hippocampal slice conditions. By 5 minutes, small dense-core vesicles known to transport active zone proteins moved into more presynaptic boutons. By 30 minutes, nascent zone area decreased, without significant change in synapse area, suggesting that presynaptic vesicles were recruited to preexisting nascent zones. By 2 hours, both nascent and active zones were enlarged. Immunogold labeling revealed glutamate receptors in nascent zones; however, average distances from nascent zones to docked presynaptic vesicles ranged from 170 ± 5 nm in perfusion-fixed hippocampus to 251 ± 4 nm at enlarged synapses by 2 hours during LTP. Prior stochastic modeling suggests that decrease in glutamate concentration reduces the probability of glutamate receptor activation from 0.4 at the center of release to 0.1 just 200 nm away. Thus, conversion of nascent zones to functional active zones likely requires the recruitment of presynaptic vesicles during LTP.

Keywords: RRID:AB_1769134; RRID:AB_2113447; RRID:nif-0000-23420; RRID:nif-0000-31686; long-term potentiation; postsynaptic density; reconstruction; serial section electron microscopy; synaptic plasticity; synaptic vesicles.


Conflict of interest statement

Conflict of Interest Statement

The authors report no conflicts of interest

The authors declare no competing financial interests.

Figures

Figure 1
Figure 1
Site-specific LTP was produced from electrodes positioned in stratum radiatum of hippocampal area CA1 and monitored for 5 min (n=3 slices from 3 animals), 30 min (n=3 slices from 3 animals), or 2 hr (n=2 slices from 2 animals) prior to rapid microwave-enhanced fixation. Waveforms are average responses from the control (blue) and TBS (red) stimulation sites, before (dashed lines) and 2 hr after (solid lines) TBS at one site. (Arrows indicate the times when slices were fixed, and scale bars = 5 mV/5 msec.) The graph plots the average responses from the 2 hr experiments. Similar graphs from experiments where the slices were fixed at 5 or 30 min post TBS are published in Bourne and Harris, 2011.
Figure 2
Figure 2
Delineating nascent zones using 3DEM. (A–D) Four serial sections through a synapse from un-stimulated perfusion-fixed hippocampus show a nascent zone (NZ, aqua) at the edge of an active zone (AZ, red). Section numbers are shown in the upper right corner of each panel. (E) Another section from the same synapse demonstrates presynaptic vesicles that were categorized as docked (in contact with the presynaptic membrane, blue arrow), neighboring nondocked located < 2 vesicle diameters from the presynaptic membrane (light purple arrow), or nondocked and ≥ 2 vesicle diameters from presynaptic membrane (green arrow). (F) Distribution of vesicle diameters is presented as the percentage of vesicles across combined perfusion-fixed and slice conditions (n= 907, gray) and compared to the two potential extremes of perfusion-fixed (n= 81, black) or 2 hr LTP slices (n= 126, red). There were no significant differences in vesicle diameter between any of the series across perfusion-fixed or slice conditions or time (18 total series, one-way ANOVA, F(17,889) = 1.37, p = 0.15; vesicle numbers from the other conditions were 5 min control, 132 and LTP, 116; 30 min control, 176 and LTP, 187; and 2 hr control, 89). (G) Lateral view of the 3DEM of the synapse in A–E using same color codes. (H) Aerial view illustrates 3 separate NZs. (A–E, G, and H) Images from perfusion-fixed hippocampal area CA1 of a mature rat. Scale bar in D is 200 nm for A–E, and coordinate system in G–H has the z-direction perpendicular to the serial sections and 100 nm per arrow length.
Figure 3
Figure 3
Identification and measurement of nascent zones in 3DEM using virtual sections computed from transmission EM and tilt tomography. (A–F) Virtual sections from a synapse from perfusion-fixed hippocampus are shown. (A–D) Some docked vesicles had an evident pore (yellow arrows) and (E, F) others were pressed against the presynaptic plasma membrane (blue arrows) when viewed in the 2–3 nm virtual sections. (G) Stacked projection of the axon-spine interface (gray), AZ (red), and NZ (teal) that were first traced through the 2–3 nm virtual sections in RECONSTRUCT and then displayed orthogonal to the virtual section planes with white lines illustrating the locations of the virtual sections in (A–F). Maximum diameters of docked vesicles are illustrated as dark blue circles with scaled pores (yellow circles) circumscribed in vesicles that had them. The dashed white line bounds the region in which the same NZ was identified and measured on two of four 50 nm simulated sections for comparison. Approximately 7 nm of tissue appeared to be missing between the two ~120 nm serial sections (black band). Scale in (G) applies to (A–G).
Figure 4
Figure 4
For accuracy, nascent zone analyses were restricted to cross-sectioned synapses, which revealed the same effects of LTP as in the overall population of synapses. (A–B) An obliquely-sectioned synapse from perfusion-fixed hippocampus with en face PSD areas (red) shown in serial sections. These areas were added to a connector line (orange), which was multiplied by section thickness and corresponded to the portion of the synapse that passed between sections. Docked vesicles could have been obscured within the section by the en face PSD at a potential NZ (aqua arrow, NZ?). Scale bar is 200 nm. Section numbers are shown in the upper right corner of each panel. (C) 3D reconstructions of sample dendritic segments (yellow) from the 2 hr control and LTP conditions illustrating cross-sectioned PSDs that were included (red) and obliquely sectioned PSDs that were excluded (dark gray) from subsequent analyses. Scale cube is 500 nm per side. (D) When combined across control and LTP slice conditions, the average PSD area from the cross-sectioned subset of synapses (CS, light gray) was significantly less than in the overall population of synapses (All, dark gray; one-way ANOVAs, within time point, 5 min, F(1,851) = 3.94, p = 0.048*, CS n = 335, All n = 518; 30 min, F(1,1061) = 6.47, p = 0.011*, CS n = 437, All n = 626; 2 hr, F(1,989) = 5.24, p = 0.022*, CS n = 399, All n = 592). (E) Changes (Δ) in PSD area for CS synapses (pink) and All synapses (red) relative to time-matched controls were calculated by subtracting the control mean PSD area from each data point by experiment and averaging the results across condition. CS PSD area was unchanged following TBS at 5 min (hnANOVA, F(1,315) = 0.49, p = 0.49) and 30 min (hnANOVA, F(1,412) = 0.36, p = 0.55) but increased significantly at 2 hr during LTP (hnANOVA, F(1,381) = 24.7, p < 0.0001****). Similarly, All PSD area was unchanged following TBS at 5 min (hnANOVA, F(1,498) = 0.003, p = 0.95) and 30 min (hnANOVA, F(1,601) = 1.2, p = 0.27) but increased significantly at 2 hr during LTP (hnANOVA, F(1,574) = 20.5, p < 0.0001****). Data were reanalyzed from Bourne and Harris, 2011.
Figure 5
Figure 5
Location and frequency of nascent zones. (Ai–iv) Serial EM images through an AZ (red) without an NZ from the 5 min LTP condition. Section numbers are shown in the lower left corner of each panel. (B) 3DEMs of synapses from various slice conditions as indicated, and with both small and large AZs (red) without NZs, and (C) with NZs (aqua), and docked vesicles (blue) and neighboring non-docked vesicles (light purple). Scale cube is 200 nm per side. (D) NZs were found primarily at the outer edges of AZs and were rarely surrounded by the AZ (inside). (E) The percentage of synapses that had NZs was unaffected by LTP (5 min, χ2 = 0.61, p = 0.43; 30 min, χ2 = 0.04, p = 0.84; 2 hr, χ2 = 0.23, p = 0.63). However, the combined 5 min and perfusion-fixed conditions demonstrated a smaller percentage of synapses with NZs compared to the combined 30 min and 2 hr conditions (χ2 = 28.7, p < 0.0001****).
Figure 6
Figure 6
Restoration of small dendritic spines and average PSD area in acute slices to levels found in perfusion-fixed hippocampus. (A) Relative to perfusion-fixed hippocampus (dashed gray line in each graph), PSD area was increased significantly in slices under both control and LTP conditions at 5 min (hnANOVA, F(1,432) = 19.2, p < 0.0001, gray****) and 30 min (hnANOVA, F(1,529) = 7.0, p < 0.001; gray***, but in only two out of three experiments). In the 2 hr LTP condition, PSD area was elevated relative to perfusion-fixed hippocampus (hnANOVA, F(2,498) = 19.4, p < 0.0001, post-hoc Tukey, p < 0.0001, gray****) and the 2 hr control condition (post-hoc Tukey p < 0.0001, black bracket****), while the 2 hr control condition was comparable to the perfusion-fixed condition (post-hoc Tukey, p = 0.97). (B) Restricting these comparisons to perfusion-fixed versus slice control conditions (data shown in A) revealed greater PSD areas (hnANOVA, F(3,932) = 10.4, p < 0.0001) at 5 min (post-hoc Tukey, p < 0.0001****) and at 30 min (p < 0.01**), but not at 2 hr (post-hoc Tukey, p = 0.35). In addition, control PSD areas did not differ significantly among spines with head diameters < 0.45 μm (hnANOVA, F(2,493) = 0.33, p = 0.72; 5 min n=170, 30 min n = 183, and 2 hr n = 171) or ≥ 0.45 μm (hnANOVA, F(2,260) = 0.16, p = 0.85, 5 min n= 122, 30 min n = 97, 2 hr n = 72). (C) The control dendrites at 5 and 30 min (combined) had significantly lower spine densities than perfusion-fixed dendrites (t(28) = 2.1, p = 0.044; p values also shown individually), which were restored to the perfusion-fixed levels by 2 hr in control dendrites (t(15) = −0.57, p = 0.58). The density of spines with head diameter < 0.45 μm on control dendrites was unchanged between 5 and 30 min (t(20) = −0.39, p = 0.70) but increased significantly between 5 min and 2 hr (t(17) = −2.5, p = 0.021, black bracket*). In contrast, the density of spines with head diameter ≥ 0.45 μm was unchanged between 5 min and 30 min (t(20) = 1.0, p = 0.31) or 2 hr (t(17) = 0.44, p = 0.66) after TBS. The number of dendrites evaluated for spine density in each control condition included: perfusion-fixed, n = 8; 5 min, n=10; 30 min, n=12; and 2 hr, n=9.
Figure 7
Figure 7
Influence of the presence of nascent zones on active zone size during constitutive synaptogenesis and LTP. (A) AZ areas at synapses without NZs: Relative to perfusion fixed hippocampus (dashed gray line in each graph), AZ areas were not significantly altered in the combined 5 min (hnANOVA, F(1,257) = 2.1, p = 0.15) or 30 min (hnANOVA, F(1,238) = 0.080, p = 0.78) conditions, and increased significantly in the 2 hr LTP condition (hnANOVA, F(2,255) = 10.7, p < 0.0001; post-hoc Tukey, p = 0.042, gray*) but not in the 2 hr control condition (post-hoc Tukey, p = 0.081). Relative to time-matched controls, there was no change following TBS at 5 min (hnANOVA, F(1,183) = 0.021, p = 0.89) or 30 min (hnANOVA, F(1,164) = 0.024, p = 0.88), although by 2 hr during LTP there was a significant increase (hnANOVA, F(1,181) = 18.6, p < 0.0001, black bracket****). (B) For synapses with NZs: the AZ areas were significantly increased relative to perfusion-fixed levels for combined conditions at 5 min (hnANOVA, F(1,147) = 27.7, p < 0.0001, gray****) and 30 min (hnANOVA, F(1,259) = 6.1, p = 0.014, gray*, but in only two out of three experiments), and in the 2 hr LTP condition (hnANOVA, F(2,216) = 10.6, p < 0.001; post-hoc Tukey, p < 0.001, gray***), but not in the 2 hr control condition (post-hoc Tukey, p = 0.32). Relative to time-matched controls, there were no significant changes following TBS at 5 min (hnANOVA, F(1,111) = 1.7, p = 0.20) or 30 min (hnANOVA, F(1,223) = 0.53, p = 0.47); however, the AZs with NZs were larger by 2 hr during LTP (hnANOVA, F(1,180) = 7.9, post-hoc Tukey, p < 0.01, black bracket**).
Figure 8
Figure 8
Direct effects of LTP on nascent zones. (A) The summed NZ area per synapse was correlated with PSD area but did not change following TBS at 5 min (control, r = 0.69, p < 0.0001; LTP, r = 0.73, p < 0.0001; ANCOVA, F(1,125) = 0.28, p = 0.60) or (B) at 30 min (control, r = 0.72, p < 0.0001; LTP, r = 0.52, p < 0.0001; ANCOVA, F(1,241) = 7.4, p < 0.01). (C) Summed NZ area remained well-correlated with PSD area in the 2 hr condition, and increased significantly during LTP (control, r = 0.49, p < 0.0001; LTP, r = 0.65, p < 0.0001; ANCOVA, F(1,195) = 11.4, p < 0.001). For PSD areas ≥ 0.4 μm2 and NZ areas ≥ 0.1 μm2 the following points are plotted: 5 min LTP (0.61 μm2, 0.069 μm2), 30 min control (0.43 μm2, 0.065 μm2; 0.61 μm2, 0.085 μm2), 30 min LTP (0.54 μm2, 0.054 μm2), and 2 hr LTP (0.34 μm2, 0.12 μm2; 0.66 μm2, 0.089 μm2; 0.62 μm2, 0.050 μm2).
Figure 9
Figure 9
Determining whether nascent zones were large enough to account for active zone growth at 2 hr during LTP. (A) AZ area increased significantly during LTP on small spines (head diameter < 0.36 μm, hnANOVA, F(1,167) = 12.5, p < 0.001***) and (B) large spines (head diameter > 0.36 μm, hnANOVA, for LTP, F(1,194) = 13.5, p < 0.001***). Changes (Δ) were calculated by subtracting the control mean AZ area from each data point by experiment and averaging the results across condition to compare changes in AZ area to summed (Σ) NZ areas. The mean and largest summed NZ areas that were found on small or large spines in the 2 hr control condition are plotted, as are the number of each required to be converted to achieve the mean AZ enlargement at 2 hr during LTP.
Figure 10
Figure 10
Presynaptic dense core vesicles (DCVs) and nascent zone conversions during LTP. (A) DCVs were identified (arrowhead) in the presynaptic boutons of cross-sectioned synapses from slice experiments and combined for frequency analyses with findings from synapses sectioned in all orientations. (B) DCV (arrowhead) fusing with presynaptic membrane (image from a recovered mature hippocampal slice, previously published in Sorra et al., 2006). Scale bar in A is 100 nm for A–B. (C) Proposed DCV involvement in nascent to active zone conversion. 3D reconstruction with AZ (red), NZ (aqua), DCV (black), docked vesicles (blue), and neighboring nondocked vesicles (light purple). Arrow annotates DCV insertion and overlap at a nascent zone. Scale cube is 100 nm per side. (D) Comparisons to time-matched controls show an increase in the percentage of boutons with DCVs at 5 min after TBS (χ2 = 9.87, p < 0.01**; control 20%, n = 423 boutons; LTP 30%, n = 305 boutons), but not at 30 min (χ2 = 0.25, p = 0.62; control 43%, n = 161; LTP 46%, n = 180) or 2 hr during LTP (χ2 = 0.51, p = 0.47; control 30%, n = 115; LTP 34%, n = 180). Changes (Δ) were calculated by subtracting control percentages from LTP percentages at each time point. (E) DCV surface areas are plotted as percent of all the measured DCVs from slices (gray) and from just the 5 min LTP condition (red). The DCV diameters used to calculate DCV surface areas did not differ across slice conditions (main effects ANOVA, time point: F(2,822) = 0.44, p = 0.64; condition: F(1,822) = 2.36, p = 0.12, see also Table 2). (F, G) Individual NZ areas were divided by the overall mean DCV surface area in slices (0.021 ± 0.0002 μm2), and the resulting distribution of the number of DCVs that would be needed for their full conversion to AZ area is shown at (F) 30 min (control mean = 0.54 ± 0.03, LTP mean = 0.46 ± 0.02) and (G) 2 hr (control mean = 0.40 ± 0.03, LTP mean = 0.69 ± 0.05). Dotted line indicates 1 DCV necessary for full conversion.
Figure 11
Figure 11
The density of docked vesicles decreased as active zones were enlarged during LTP. (A) The density of docked vesicles per AZ area was correlated with PSD area and unchanged at 5 min after TBS relative to control stimulation (control, r = 0.86, p < 0.0001; LTP, r = 0.83, p < 0.0001; ANCOVA, F(1,327) = 0.37, p = 0.54). (B) By 30 min after TBS, the density of docked vesicles per AZ area remained well correlated with AZ area; however, the density decreased relative to control stimulation (control, r = 0.87, p < 0.0001; LTP, r = 0.79, p < 0.0001; ANCOVA, F(1,430) = 21.7, p < 0.0001). (C) 3D examples of small and large synapses illustrate representative docked vesicle distributions at AZs in the 2 hr control and LTP conditions. Scale cube, 200 nm per side. (D) Docked vesicle density remained well correlated with AZ area but decreased by 2 hr during LTP (control, r = 0.94, p < 0.0001; LTP, r = 0.89, p < 0.0001; ANCOVA, F(1,392) = 34.6, p < 0.0001). Several points were included in the AZ area ≥ 0.4 μm2 and docked vesicle number ≥ 60 categories, including: 5 min control (0.32 μm2, 75; 0.31 μm2, 65) and LTP (0.54 μm2, 55; 0.26 μm2, 62), 30 min control (0.52 μm2, 39) and LTP (0.49 μm2, 15), and 2 hr LTP (0.57 μm2, 59; 0.57 μm2, 69).
Figure 12
Figure 12
Proximity of nascent zones to glutamate release sites. (A–D) Four serial sections from an unstimulated hippocampal slice illustrates gold-labeled GluA1 (arrowheads), NZ (aqua), and AZ (red). GluA1 labeling was found in the NZ (B) and in the AZ (A, C, D). Scale bar is 500 nm. Section numbers from the series are labeled in the upper right corner. (E) 3D reconstruction of an average-sized synapse with one NZ (top) and a large synapse with two NZs (bottom), both from the 2 hr LTP condition. AZ (red), NZs (aqua), and docked vesicles (blue) with white arrows illustrating example distances measured from docked vesicles to an edge of the NZs. (F) Distribution of minimum distances between each docked vesicle and NZ(s) on the same synapse in the perfusion-fixed (gray) and 2 hr control (blue) and LTP (red) conditions. (G) Mean minimum distance between docked vesicles and NZ(s) increased in the 2 hr LTP condition relative to perfusion-fixed hippocampus (hnANOVA, F(1,3811) = 60.2, p < 0.0001; post-hoc Tukey p < 0.0001****) and 2 hr control (post-hoc Tukey p < 0.0001****).
Figure 13
Figure 13
Model incorporating nascent zone conversion and growth during the synaptic plasticity associated with LTP. Colors represent: axonal bouton (green), AZ (red), NZs (aqua), DCV (dark gray), docked vesicles (dark blue), and nondocked small synaptic vesicles located within 94 nm of the presynaptic membrane (white).

References

    1. Ahmari SE, Buchanan J, Smith SJ. Assembly of presynaptic active zones from cytoplasmic transport packets. Nat Neurosci. 2000;3(5):445–51. - PubMed
    1. Ahmari SE, Smith SJ. Knowing a nascent synapse when you see it. Neuron. 2002;34(3):333–6. - PubMed
    1. Akins MR, Biederer T. Cell-cell interactions in synaptogenesis. Curr Opin Neurobiol. 2006;16(1):83–9. - PubMed
    1. Allen C, Stevens CF. An evaluation of causes for unreliability of synaptic transmission. Proc Natl Acad Sci U S A. 1994;91(22):10380–3. - PMC - PubMed
    1. Ashby MC, Maier SR, Nishimune A, Henley JM. Lateral diffusion drives constitutive exchange of AMPA receptors at dendritic spines and is regulated by spine morphology. J Neurosci. 2006;26:7046–55. - PMC - PubMed

Publication types

MeSH terms

Substances

LinkOut - more resources