. 2014 Aug 29;289(35):24499-510.
doi: 10.1074/jbc.M113.521856. Epub 2014 Jul 20.

Structural insights into the low pH adaptation of a unique carboxylesterase from Ferroplasma: altering the pH optima of two carboxylesterases

Affiliations

Structural insights into the low pH adaptation of a unique carboxylesterase from Ferroplasma: altering the pH optima of two carboxylesterases

Kazuhiro Ohara et al. J Biol Chem. .

Abstract

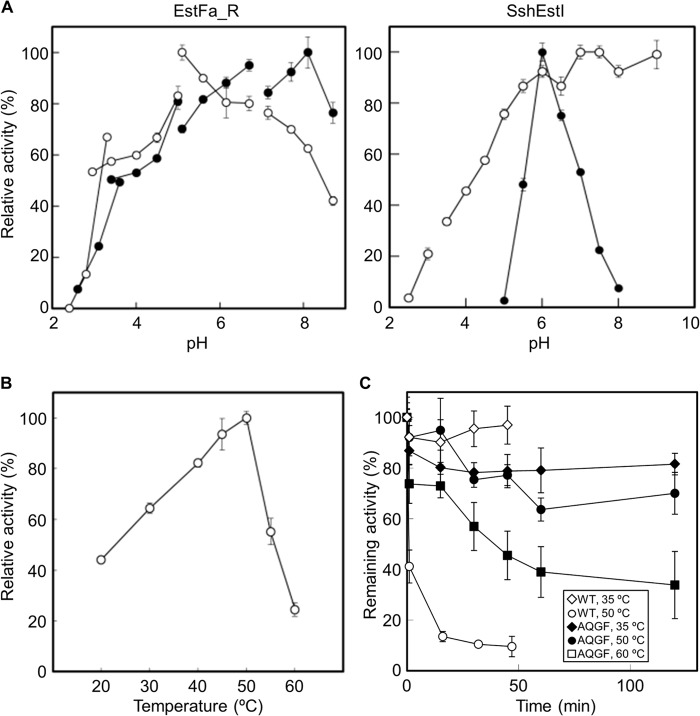
To investigate the mechanism for low pH adaptation by a carboxylesterase, structural and biochemical analyses of EstFa_R (a recombinant, slightly acidophilic carboxylesterase from Ferroplasma acidiphilum) and SshEstI (an alkaliphilic carboxylesterase from Sulfolobus shibatae DSM5389) were performed. Although a previous proteomics study by another group showed that the enzyme purified from F. acidiphilum contained an iron atom, EstFa_R did not bind to iron as analyzed by inductively coupled plasma MS and isothermal titration calorimetry. The crystal structures of EstFa_R and SshEstI were determined at 1.6- and 1.5-Å resolutions, respectively. EstFa_R had a catalytic triad with an extended hydrogen bond network that was not observed in SshEstI. Quadruple mutants of both proteins were created to remove or introduce the extended hydrogen bond network. The mutation on EstFa_R enhanced its catalytic efficiency and gave it an alkaline pH optimum, whereas the mutation on SshEstI resulted in opposite effects (i.e. a decrease in the catalytic efficiency and a downward shift in the optimum pH). Our experimental results suggest that the low pH optimum of EstFa_R activity was a result of the unique extended hydrogen bond network in the catalytic triad and the highly negatively charged surface around the active site. The change in the pH optimum of EstFa_R happened simultaneously with a change in the catalytic efficiency, suggesting that the local flexibility of the active site in EstFa_R could be modified by quadruple mutation. These observations may provide a novel strategy to elucidate the low pH adaptation of serine hydrolases.

Keywords: Archaea; Carboxylesterase; Enzyme Mechanism; Enzyme Structure; Ferroplasma acidiphilum; Hydrolase; Serine Hydrolase; pH Adaptation.


Figures

FIGURE 1.
FIGURE 1.
Purification and isothermal titration calorimetry of EstFa_R. A, purified EstFa_R analyzed by SDS-PAGE. Calorimetric titrations of EstFa_R either at pH 7 (B) or at pH 5 (C) with Fe2+ or Fe3+ ions under anaerobic conditions were performed. The top panels contain raw binding data, and the bottom panels show the binding isotherms created by integrations of heat peaks against the molar ratio of the ligand. D, calorimetric titrations of apotransferrin (bovine) with Fe2+ ion.
FIGURE 2.
FIGURE 2.
Effects of pH, temperature, and heat treatment on enzyme activities of EstFa_R, SshEstI, and their quadruple mutants. A, left, pH dependences of pNP butyrate hydrolysis catalyzed by EstFa_R (open circles) and its AQGF mutant (closed circles). Right, pH dependences of pNP butyrate hydrolysis catalyzed by SshEstI (open circles) and its NPES mutant (closed circles). The kcat values at each pH point were calculated for all enzymes, and the maximal activity in each enzyme was taken to be 100%. B, temperature-activity profiles of EstFa_R. The maximal activity at 50 °C was taken to be 100%. C, courses of thermal inactivation of EstFa_R and its AQGF mutant. Enzyme activities at zero time of incubation were taken to be 100%. Error bars represent S.D.
FIGURE 3.
FIGURE 3.
Crystal structures of EstFa_R and SshEstI. A, monomer structures of EstFa_R (left) and SshEstI (right) are shown in ribbon diagrams. Different colors in each structure indicate the subdomains of each enzyme. B, superposition of backbone traces of EstFa_R (purple) and SshEstI (cyan). C, topology diagrams of EstFa_R and SshEstI. The β-strands and α-helices are indicated by arrows and cylinders, respectively. Residue numbers at the ends of secondary structure elements are given. Colors in each diagram correspond to that of crystal structures in A.
FIGURE 4.
FIGURE 4.
Hydrogen bond networks mediated by catalytic triads. A, the interactions in EstFa_R, SshEstI, and its PE mutant are represented in stick models (top) and in stick models with the 2mFoDFc electron density maps (bottom) at the 1.5σ level (gray). The catalytic triad residues are shown as green-based sticks. Dotted lines designate hydrogen bonds. Characteristic residues of EstFa_R that form extended hydrogen bonds are labeled in red. Oxygen atoms of water molecules are indicated in spheres. B, schematic representation of hydrogen bond networks mediated by catalytic triads of EstFa_R, SshEstI, and its PE mutant. Hydrogen bonds are shown by dotted lines. Target sites of double or quadruple mutations are shown with purple arrowheads. Extended hydrogen bonds and the related residues in EstFa_R are labeled and shown in red. Distances (in Å) between Glu-257 in EstFa_R and the main-chain oxygen atoms of Pro-185 and Leu-253 are shown with blue double-headed arrows. Likewise, distances between Glu-250 (shown in red) in the PE mutant of SshEstI and Pro-178 and Leu-246 are shown. C, target sites of mutagenesis are shown in an alignment of partial amino acid sequences of carboxylesterases and related enzymes from Archaea. The catalytic His and Asp residues (indicated by circles) of EstFa and SshEstI are shown in green. Amino acid residues that are unique to EstFa (Asn-248, Pro-256, Glu-257, and Ser-283) are shown in purple, and the amino acids conserved at the corresponding positions in SshEstI (shown in cyan) and other proteins are indicated by boxes. The protein sequences used (from top to bottom) are as follows: EstFa (this study); Sis, Sulfolobus islandicus esterase (GenBank accession number YP_007864753); Sso, Sulfolobus solfataricus lipase (NP_343839); SshEstI (this study); Mcu, Metallosphaera cuprina α/β-hydrolase (YP_004410361); Mse, Metallosphaera sedula α/β-hydrolase (YP_001191160); Sis2, S. islandicus M.14.25 α/β-hydrolase; Pca, Pyrobaculum calidifontis α/β-hydrolase (YP_001056197); Tuz, Thermoproteus uzoniensis carboxylesterase (YP_004337620); AFEST, Archaeoglobus fulgidus carboxylesterase (NP_070544); EST2, A. acidocaldarius carboxylesterase (2HM7_A); Pto, Picrophilus torridus carboxylesterase (YP_024159); and Tvo, Thermoplasma volcanium esterase (NP_111246).
FIGURE 5.
FIGURE 5.
Properties of SshEstI mutants. A, thermal activations and inactivations of the NPES mutant of SshEstI. Symbols and the temperatures for heat treatments are described in the figures. Enzyme activities at zero time of incubation were taken to be 100%. B, pH-activity profiles of pNP butyrate hydrolysis catalyzed by the double PE mutant of SshEstI (closed circles) or the triple mutants of SshEstI (NES, open triangles; NPS, closed diamonds; NPE, open squares; and PES, closed triangles). The relative activities were calculated as in Fig. 2A. Error bars represent S.D.
FIGURE 6.
FIGURE 6.
Structural features of EstFa_R, SshEstI, and other esterases. A, left, ribbon diagrams of the two structures are colored according to an absolute gradient in the B-factor from blue (a low B-factor) through red (a high B-factor). Areas around the active sites of each enzyme are indicated by dotted circles. Middle, surface representations (transparent) with ribbon diagrams (gray). The catalytic triads in the two structures are shown in green sticks. Right, electrostatic surface representations of the two structures. Regions with potentials above +3kT (blue) and below −3kT (red) were calculated by the APBS (23) tool within the PyMOL program (21). B, electrostatic surface representations for other archaeal esterases. Potentials in each structure are colored as in A. Areas around the active sites of each enzyme are indicated by dotted circles. AFEST (Protein Data Bank code 1JJI) and EST2 (Protein Data Bank code 1EVQ) were defined in Fig. 4 legend. PestE (Protein Data Bank code 3ZWQ) and Sto-Est (Protein Data Bank code 3AIK), esterases from P. calidifontis and Sulfolobus tokodaii, respectively.

References

    1. Simon G. M., Cravatt B. F. (2010) Activity-based proteomics of enzyme superfamilies: serine hydrolases as a case study. J. Biol. Chem. 285, 11051–11055 - PMC - PubMed
    1. Arpigny J. L., Jaeger K. E. (1999) Bacterial lipolytic enzymes: classification and properties. Biochem. J. 343, 177–183 - PMC - PubMed
    1. Jaeger K. E., Reetz M. T. (1998) Microbial lipases form versatile tools for biotechnology. Trends Biotechnol. 16, 396–403 - PubMed
    1. Jaeger K. E., Dijkstra B. W., Reetz M. T. (1999) Bacterial biocatalysts: molecular biology, three-dimensional structures, and biotechnological applications of lipases. Annu. Rev. Microbiol. 53, 315–351 - PubMed
    1. Wei Y., Contreras J. A., Sheffield P., Osterlund T., Derewenda U., Kneusel R. E., Matern U., Holm C., Derewenda Z. S. (1999) Crystal structure of brefeldin A esterase, a bacterial homolog of the mammalian hormone-sensitive lipase. Nat. Struct. Biol. 6, 340–345 - PubMed

Substances

LinkOut - more resources