. 2014 Dec;35(12):5834-46.
doi: 10.1002/hbm.22588. Epub 2014 Jul 15.

Role of the sensorimotor cortex in Tourette syndrome using multimodal imaging

Affiliations

Role of the sensorimotor cortex in Tourette syndrome using multimodal imaging

Sule Tinaz et al. Hum Brain Mapp. 2014 Dec.

Abstract

Tourette syndrome (TS) is a neuropsychiatric disorder characterized by motor and vocal tics. Most patients describe uncomfortable premonitory sensations preceding the tics and a subjective experience of increased sensitivity to tactile stimuli. These reports indicate that a sensory processing disturbance is an important component of TS together with motor phenomena. Thus, we focused our investigation on the role of the sensorimotor cortex (SMC) in TS using multimodal neuroimaging techniques. We measured the gamma-aminobutyric acid (GABA)+/Creatine (Cre) ratio in the SMC using GABA (1) H magnetic resonance spectroscopy. We recorded the baseline beta activity in the SMC using magnetoencephalography and correlated GABA+/Cre ratio with baseline beta band power. Finally, we examined the resting state functional connectivity (FC) pattern of the SMC using functional magnetic resonance imaging (fMRI). GABA+/Cre ratio in the SMC did not differ between patients and controls. Correlation between the baseline beta band power and GABA+/Cre ratio was abnormal in patients. The anterior insula showed increased FC with the SMC in patients. These findings suggest that altered limbic input to the SMC and abnormal GABA-mediated beta oscillations in the SMC may underpin some of the sensorimotor processing disturbances in TS and contribute to tic generation.

Keywords: beta oscillations; functional connectivity; functional magnetic resonance imaging; gamma-aminobutyric acid; magnetic resonance spectroscopy; magnetoencephalography; resting state.


Figures

Figure 1
Figure 1
The central sulcus and “hand knob” area were identified on each subject's axial anatomical image. The GABA 1H MRS voxel (30 × 25 × 25 mm) was centered at the right “hand knob” avoiding the skull and lateral ventricles.
Figure 2
Figure 2
Left SMC FC maps. Left column: HV group. Significant FC with mid‐ and posterior insula, putamen, thalamus, cuneus, and TPJ (top), and with SMC, SMA, and superior frontal gyrus (bottom) are shown. Right column: TS group. Significant FC with AI, mid‐ and posterior insula, thalamus, cuneus, TPJ, and left anterior putamen (top), and with SMC and SMA (bottom) are shown at P ≤ 0.05, corrected for the whole brain. Z‐statistic maps were thresholded at z = 3.95. Z coordinate for top images is 8 mm, for bottom 46 mm. See Tables 4 and V for coordinates and z scores. While visual comparison of these maps shows differences in some regions, these differences were generally weak and did not survive the between‐group comparison at P ≤ 0.05, corrected for the whole brain. [Color figure can be viewed in the online issue, which is available at http://wileyonlinelibrary.com.]
Figure 3
Figure 3
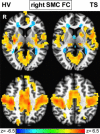
Right SMC FC maps. Left column: HV group. Significant FC with mid‐ and posterior insula, putamen, thalamus, and cuneus (top), and with SMC, SMA, and superior frontal gyrus (bottom) are shown. Right column: TS group. Significant FC with AI, mid‐ and posterior insula, thalamus, cuneus, and left anterior putamen (top), and with SMC and SMA (bottom) are shown at P ≤ 0.05, corrected for the whole brain. Z‐statistic maps were thresholded at z = 3.95. Z coordinate for top images is 8 mm, for bottom 46 mm. See Tables 6 and VII for coordinates and z scores. While visual comparison of these maps shows differences in some regions, these differences were generally weak and did not survive the between‐group comparison at P ≤ 0.05, corrected for the whole brain. [Color figure can be viewed in the online issue, which is available at http://wileyonlinelibrary.com.]
Figure 4
Figure 4
Box plots demonstrate the mean and standard deviation values of correlations between the right AI‐right SMC and right AI‐left SMC for both HV and TS groups. See Post hoc Results section for details.
Figure 5
Figure 5
GABA+/Cre ratio obtained from the GABA 1H MRS voxel centered at the “hand knob” area in the right SMC is plotted against the normalized baseline beta band power recorded from the right SMC sensors using MEG. HVs (N = 11) showed a positive, but nonsignificant, correlation (r = 0.4, P = 0.22), while TS patients (N = 13) showed a significantly negative correlation between the two (r = −0.61, P = 0.026).

References

    1. Arzy S, Thut G, Mohr C, Michel CM, Blanke O (2006): Neural basis of embodiment: Distinct contributions of temporoparietal junction and extrastriate body area. J Neurosci 26:8074–8081. - PMC - PubMed
    1. Barkley RA (2011): Barkley Adult ADHD Rating Scale‐IV (BAARS‐IV). New York: Guilford Press.
    1. Belluscio BA, Jin L, Watters V, Lee TH, Hallett M (2011): Sensory sensitivity to external stimuli in Tourette syndrome patients. Mov Disord 26:2538–2543. - PMC - PubMed
    1. Berman BD, Horovitz SG, Morel B, Hallett M (2012): Neural correlates of blink suppression and the buildup of a natural bodily urge. Neuroimage 59:1441–1450. - PMC - PubMed
    1. Bohlhalter S, Goldfine A, Matteson S, Garraux G, Hanakawa T, Kansaku K, Wurzman R, Hallett M (2006): Neural correlates of tic generation in Tourette syndrome: An event‐related functional MRI study. Brain 129 (Pt 8):2029–2037. - PubMed

Publication types