. 2014 Oct;22(10):2252-9.
doi: 10.1002/oby.20840. Epub 2014 Jul 21.

Genome-wide association study of height-adjusted BMI in childhood identifies functional variant in ADCY3

Affiliations
Free PMC article

Genome-wide association study of height-adjusted BMI in childhood identifies functional variant in ADCY3

Evangelia Stergiakouli et al. Obesity (Silver Spring). 2014 Oct.
Free PMC article

Abstract

Objective: Genome-wide association studies (GWAS) of BMI are mostly undertaken under the assumption that "kg/m(2) " is an index of weight fully adjusted for height, but in general this is not true. The aim here was to assess the contribution of common genetic variation to a adjusted version of that phenotype which appropriately accounts for covariation in height in children.

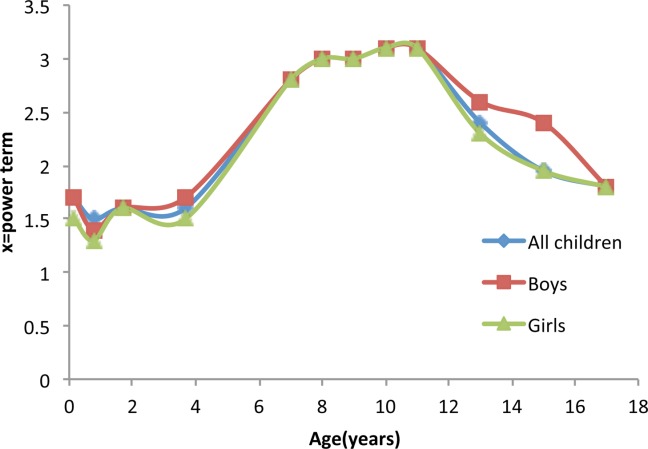
Methods: A GWAS of height-adjusted BMI (BMI[x] = weight/height(x) ), calculated to be uncorrelated with height, in 5809 participants (mean age 9.9 years) from the Avon Longitudinal Study of Parents and Children (ALSPAC) was performed.

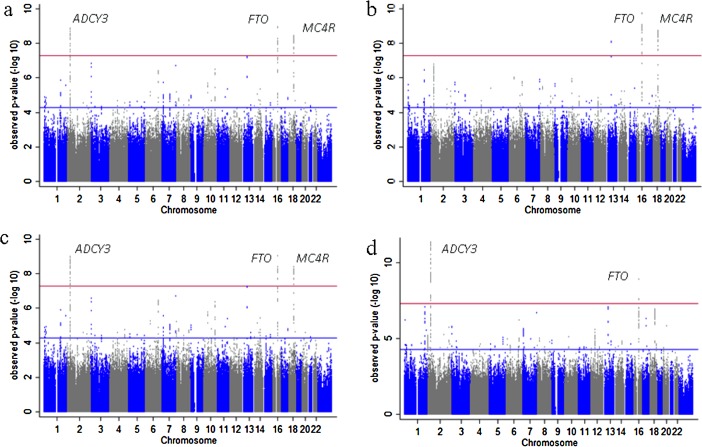
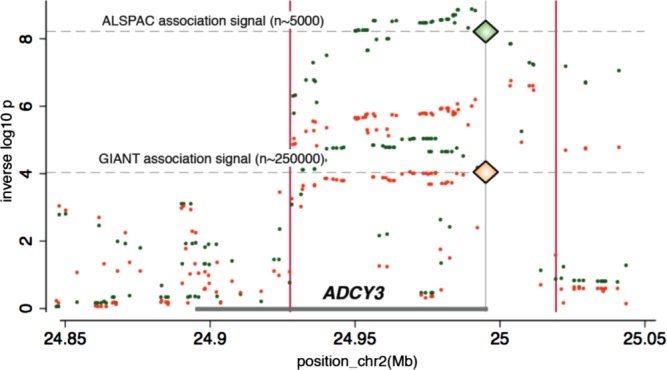
Results: GWAS based on BMI[x] yielded marked differences in genomewide results profile. SNPs in ADCY3 (adenylate cyclase 3) were associated at genome-wide significance level (rs11676272 (0.28 kg/m(3.1) change per allele G (0.19, 0.38), P = 6 × 10(-9) ). In contrast, they showed marginal evidence of association with conventional BMI [rs11676272 (0.25 kg/m(2) (0.15, 0.35), P = 6 × 10(-7) )]. Results were replicated in an independent sample, the Generation R study.

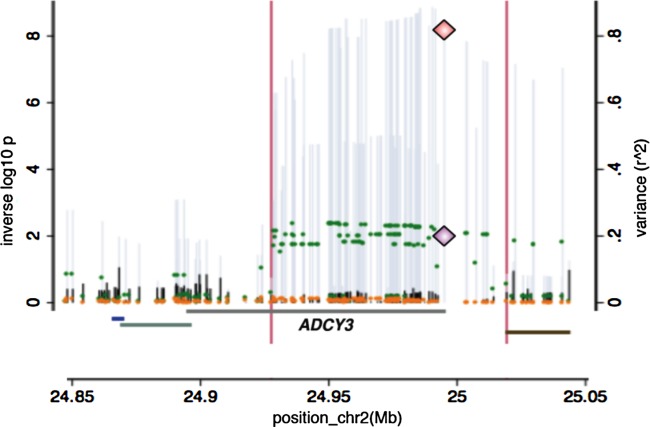
Conclusions: Analysis of BMI[x] showed differences to that of conventional BMI. The association signal at ADCY3 appeared to be driven by a missense variant and it was strongly correlated with expression of this gene. Our work highlights the importance of well understood phenotype use (and the danger of convention) in characterising genetic contributions to complex traits.


Figures

Figure 1
Figure 1
Power term [x] required for the least correlation of BMI[x] = weight/(height)x with height. This is reflected by the correlation coefficient across different age groups in all children from the Avon Longitudinal Study of Parents and Children (ALSPAC) study and stratified by sex. [Color figure can be viewed in the online issue, which is available at wileyonlinelibrary.com.]
Figure 2
Figure 2
Manhattan plots of the results from genome-wide association studies (GWAS) on BMI. (a) ALSPAC GWAS on BMI[3.1] adjusted for sex and age, (b) ALSPAC GWAS on BMI adjusted for sex and age, (c) ALSPAC GWAS on BMI adjusted for sex, age, and height, and (d) meta-analysis of ALSPAC and Generation R GWAS on BMI adjusted for sex, age, and height. [Avon Longitudinal Study of Parents and Children (ALSPAC)].
Figure 3
Figure 3
Regional plots in ADCY3(adenylate cyclase 3) locus showing that the association at the locus is attributed to rs11676272. (a) BMI adjusted for height, age and sex in ALSPAC, (b) BMI adjusted for height, age and sex conditioning on rs11676272 in ALSPAC. Each circle represents a SNP plotted by its position on the chromosome against its association (−log10 P). The SNPs are colored according to their linkage disequilibrium (LD) with rs11676272 using pairwise r2 values from HapMap CEU samples. The diagram in light blue represents the LD structure in the region. Data for gene structure from UCSC Genome Browser are shown below the diagram. Plots were generated using LocusZoom [Avon Longitudinal Study of Parents and Children (ALSPAC)].
Figure 4
Figure 4
Genetic and expression data on the ADCY3 (adenylate cyclase 3) locus. Overlay of the GWAS on BMI adjusted for height results (left axis and grey spikes), the GWAS on BMI adjusted for height conditioning on rs11676272 dose (left axis and black spikes), the association of the expression of ADCY3 by the same variants in the region (expressed as r2 on the right axis and green dots) and the residual variation in expression after regression on rs11676272 (orange dots). The diamonds indicate the position of rs11676272 p values for the test for association with BMI adjusted for height (top diamond) and gene expression results expressed as r2 (bottom diamond).
Figure 5
Figure 5
Regional plot for ADCY3 (adenylate cyclase 3) locus with ALSPAC and the Genetic Investigation of ANthropometric Traits (GIANT) meta-analysis data . Green circles represent SNPs and their association with BMI[3.1] in ALSPAC and orange circles represent SNPs and their association with BMI in the GIANT meta-analysis. rs11676272 is indicated by a diamond. [Avon Longitudinal Study of Parents and Children (ALSPAC)].
Figure 6
Figure 6
In situ hybridization data from the Allen Mouse Brain Atlas. Darker staining is seen in coronal sections of adult mouse brains indicating ADCY3 (adenylate cyclase 3) mRNA expression within the hypothalamus, including the (a) suprachiasmatic, (b) paraventricular, (c) ventromedial, and (d) arcuate nucleus. Data from Allen Mouse Brain Atlas (http://mouse.brainmap.org/experiment/ivt?id=75&popup=true). [Color figure can be viewed in the online issue, which is available at wileyonlinelibrary.com.]

Comment in

References

    1. Davey Smith G. Pearls of wisdom: Eat, drink, have sex (using condoms), abstain from smoking and be merry. Int J Epidemiol. 2010;39:941–947. - PubMed
    1. Nevill AM, Stewart AD, Olds T, Holder R. Relationship between adiposity and body size reveals limitations of BMI. Am J Phys Anthropol. 2006;129:151–156. - PubMed
    1. Pearl R. An index of body build. Am J Phys Anthropol. 1940;26:315–348.
    1. Heo M, Kabat GC, Gallagher D, Heymsfield SB, Rohan TE. Optimal scaling of weight and waist circumference to height for maximal association with DXA-measured total body fat mass by sex, age and race/ethnicity. Int J Obes(2005) 2013;37:1154–1160. - PubMed
    1. Prentice AM, Jebb SA. Beyond body mass index. Obes Rev. 2001;2:141–147. - PubMed

Publication types

LinkOut - more resources