Review
. 2015 Apr;41(4):870-83.
doi: 10.1002/jmri.24713. Epub 2014 Jul 16.

UTE imaging in the musculoskeletal system

Affiliations
Review

UTE imaging in the musculoskeletal system

Eric Y Chang et al. J Magn Reson Imaging. 2015 Apr.

Abstract

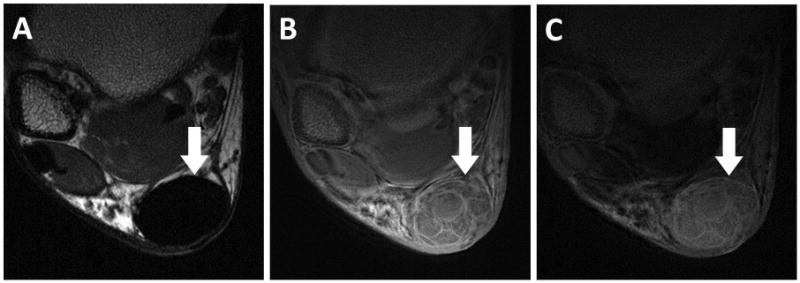
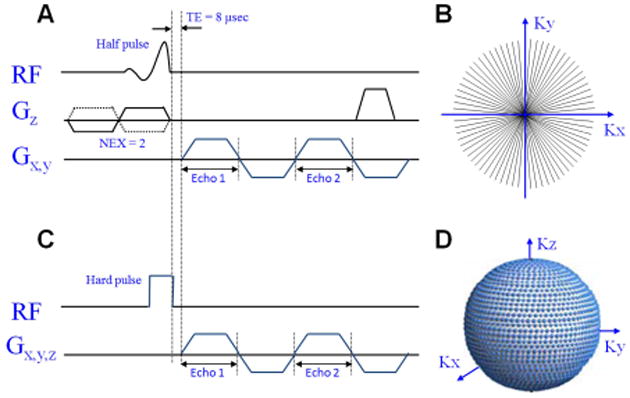
Tissues, such as bone, tendon, and ligaments, contain a high fraction of components with "short" and "ultrashort" transverse relaxation times and therefore have short mean transverse relaxation times. With conventional magnetic resonance imaging (MRI) sequences that employ relatively long echo times (TEs), there is no opportunity to encode the decaying signal of short and ultrashort T2 /T2 * tissues before it has reached zero or near zero. The clinically compatible ultrashort TE (UTE) sequence has been increasingly used to study the musculoskeletal system. This article reviews the UTE sequence as well as various modifications that have been implemented since its introduction. These modifications have been used to improve efficiency or contrast as well as provide quantitative analysis. This article reviews several clinical musculoskeletal applications of UTE.

Keywords: bicomponent analysis; musculoskeletal tissues; quantitative MRI; ultrashort TE.


Figures

Figure 1
Figure 1
Axial images of an asymptomatic volunteer after Achilles tendon repair. Proton density FSE image using 6.6 ms TE (A) shows no signal within the Achilles tendon (arrow). 3D-UTE-Cones image using 30 μs TE (B) shows internal structure of the repaired Achilles tendon. 30 μs minus 6.6 ms subtraction image (C) highlights short T2* components, which are more abundant in between healed fascicles. Images courtesy of Michael Carl, PhD.
Figure 2
Figure 2
Ultrashort TE (UTE) pulse sequence diagrams and k-space trajectories. 2D-UTE sequence uses a slice-selective half-pulse excitation followed by ramp sampling (A) to fill k-space (B). 3D-UTE sequence uses a short rectangular hard pulse excitation followed by ramp sampling (C) to fill k-space (D).
Figure 3
Figure 3
Coronal oblique images of the left shoulder. High-resolution conventional FSE sequence with 23 ms TE (A) shows no signal from the calcified cartilage (arrows). 2D-UTE image with 8 μs TE (B) shows signal but poor contrast from the calcified cartilage (arrows). T1-weighted saturation recovery image with 2D-UTE acquisition (C) highlights the calcified cartilage (arrows).
Figure 4
Figure 4
Axial MR images of a patella. High resolution spin-echo sequence with 38 ms TE (A) shows no signal from the deep radial and calcified cartilage (arrows). 8 μs minus 5 ms subtraction image (B) highlights the calcified layer of cartilage (arrows). Pixel map of mono-exponential T2* values generated from UTE images (C) with bi-exponential analysis yielding short T2* of 0.7 ms, short fraction 23%, long T2* 37.7 ms, and long fraction 77% (plot not shown).
Figure 5
Figure 5
Axial MR images through the leg of a healthy volunteer. Clinical gradient echo sequence (A) shows a signal void in the region of the tibial cortex (arrow). The UTE sequence (B) shows slightly higher signal from the tibial cortex (arrow), but poor contrast due to the high signal from the surrounding muscle and fat which limit the dynamic range for cortical bone. The IR-UTE sequence (C) selectively suppresses signal from fat and muscle creating high contrast for the short T2* components of cortical bone (arrow). An eraser (dashed arrows) with known T1 and T2* values (approximately 200 ms and 300 μs, respectively) was placed for reference.
Figure 6
Figure 6
40-year-old patient with longitudinal-horizontal tear of the posterior horn of the medial meniscus. Conventional sagittal-oblique MR image with 38 ms TE (A) shows meniscus tear (arrow). Mono-exponential T2* map generated from UTE images (B) highlights regions of degeneration (arrowheads) adjacent to the tear (arrow). Quantitative bi-exponential fitting through the superior halves of the normal anterior horn (C) and degenerated posterior horn (D) shows notable differences in the degenerated portion with longer short T2* time and smaller short T2* fraction confirming degenerative tear.
Figure 7
Figure 7
Axial MR images through the lateral meniscus of a healthy volunteer. Clinical gradient echo sequence with 12 ms TE (A) shows the C-shaped lateral meniscus (LM). 3D UTE-Cones image with 30 μs TE (B) was obtained 1 minute after intravenous gadolinium contrast administration, showing early perfusion to the peripheral meniscus (arrowheads). A 30 μs minus 12 ms subtraction image generated from dual-echo 3D UTE-Cones source images (C) 46 minutes after contrast administration shows diffusion of gadolinium into the peripheral meniscus (thin arrows). Note relatively avascular region at the popliteal hiatus (dashed arrow). Popliteus tendon is marked with an asterick.
Figure 8
Figure 8
Sagittal MR images through the TMJ. Select multi-echo images ranging from 100 μs to 25 ms (A-F) show condylar fibrocartilage (solid arrow) and TMJ disc (dashed arrow). Mono-exponential T2* fitting curve (G) shows excellent curve fitting with T2* values of 6.97 ms and 3.21 ms for the disc and fibrocartilage, respectively.
Figure 9
Figure 9
Temporomandibular joint disc of a 35-year old asymptomatic volunteer. (A) Conventional T1-weighted fast-spin echo image with mouth closed (A) shows the normal position of the TMJ disc. Quantitative pixel map generated from UTE images (B) show increased T2* values at the intermediate zone and posterior band, suggestive of early-stage degeneration. Mono-exponential T2* analysis of the entire disc (C) shows excellent curve fitting with T2* value of 11.4 ms.
Figure 10
Figure 10
60-year old man several years after successful right Achilles tendon repair. Axial UTE MR images of the repaired right Achilles tendon (A) compared with the same patient's asymptomatic left Achilles tendon (B). Quantitative bi-component analysis performed in the tendons (dashed ovals) show that the short T2* value and fraction of the repaired right tendon (C) has approached the asymptomatic left side (D), confirming adequate collagen remodeling.
Figure 11
Figure 11
Lumbar spine imaged with conventional T2-weighted FSE sequence (A) and UTE subtraction image (B) generated from 10 μs TE minus 10 ms TE. Short T2* components are directly visible in the anterior longitudinal ligament (arrow), outer annulus fibrosus (dashed arrow), and cartilaginous endplate (arrowheads) on UTE subtraction image, but not on the conventional image. Images courtesy of Won C. Bae, PhD.

References

    1. Bydder GM. Review. The Agfa Mayneord lecture: MRI of short and ultrashort T(2) and T(2)* components of tissues, fluids and materials using clinical systems. Br J Radiol. 2011;84(1008):1067–1082. - PMC - PubMed
    1. Pauly JM, Conolly SI, Nishimura D, Macovski A. Slice-Selective Excitation for Very Short T2 Species. Proceedings of the 8th Annual Meeting of ISMRM; Amsterdamn, Netherlands. 1989; abstract 28.
    1. Du J, Carl M, Diaz E, et al. Ultrashort TE T1rho (UTE T1rho) imaging of the Achilles tendon and meniscus. Magn Reson Med. 2010;64(3):834–842. - PubMed
    1. Rahmer J, Bornert P, Groen J, Bos C. Three-dimensional radial ultrashort echo-time imaging with T2 adapted sampling. Magn Reson Med. 2006;55(5):1075–1082. - PubMed
    1. Pauly JM. Selective Excitation for Ultrashort Echo Time Imaging. eMagRes: John Wiley & Sons, Ltd; 2012. - DOI

Publication types

MeSH terms