. 2014 Jul 30;136(30):10777-82.
doi: 10.1021/ja505517t. Epub 2014 Jul 21.

Mapping the protein interaction landscape for fully functionalized small-molecule probes in human cells

Affiliations

Mapping the protein interaction landscape for fully functionalized small-molecule probes in human cells

Tohru Kambe et al. J Am Chem Soc. .

Abstract

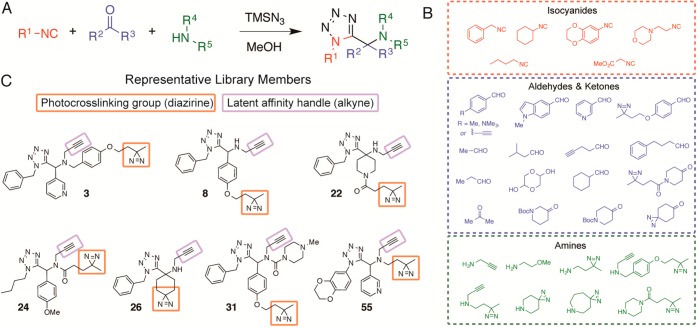
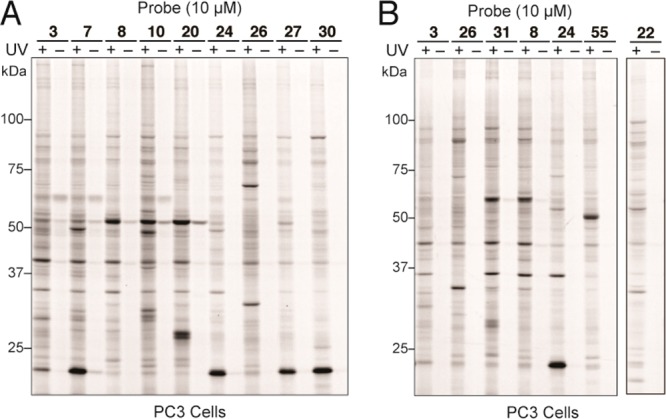
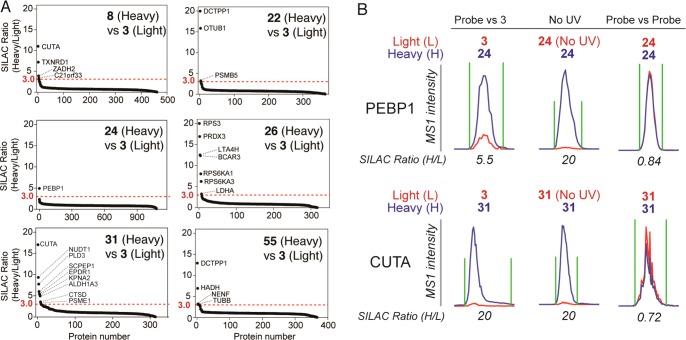
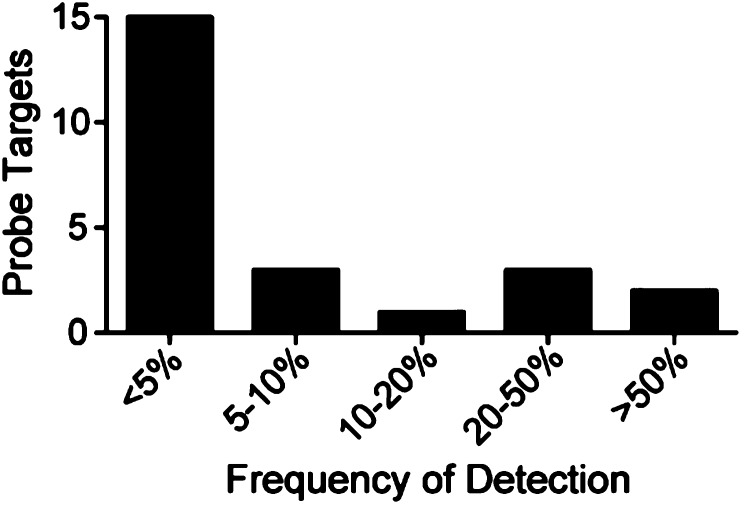
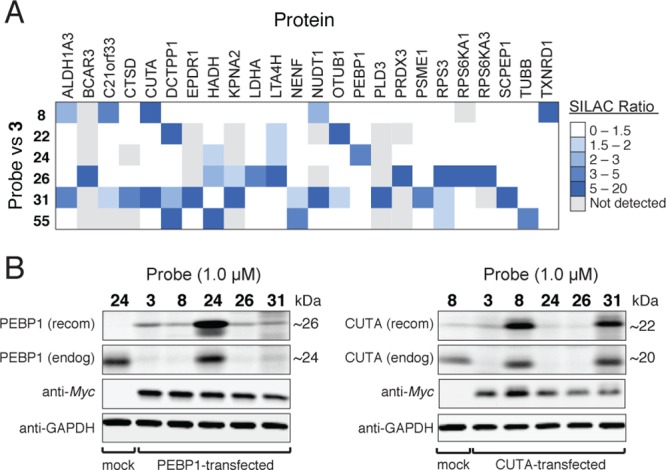
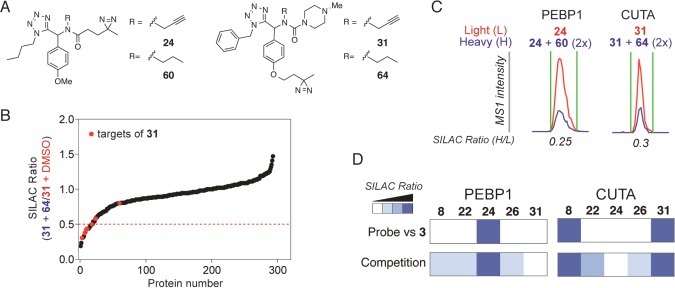
Phenotypic screening provides a means to discover small molecules that perturb cell biological processes. Discerning the proteins and biochemical pathways targeted by screening hits, however, remains technically challenging. We recently described the use of small molecules bearing photoreactive groups and latent affinity handles as fully functionalized probes for integrated phenotypic screening and target identification. The general utility of such probes, or, for that matter, any small-molecule screening library, depends on the scope of their protein interactions in cells, a parameter that remains largely unexplored. Here, we describe the synthesis of an ~60-member fully functionalized probe library, prepared from Ugi-azide condensation reactions to impart structural diversity and introduce diazirine and alkyne functionalities for target capture and enrichment, respectively. In-depth mass spectrometry-based analysis revealed a diverse array of probe targets in human cells, including enzymes, channels, adaptor and scaffolding proteins, and proteins of uncharacterized function. For many of these proteins, ligands have not yet been described. Most of the probe-protein interactions showed well-defined structure-activity relationships across the probe library and were blocked by small-molecule competitors in cells. These findings indicate that fully functionalized small molecules canvas diverse segments of the human proteome and hold promise as pharmacological probes of cell biology.


Figures

Figure 1
Figure 1
Synthesis and representative members of a fully functionalized small-molecule probe library. (A) Ugi-azide multicomponent condensation reaction used to synthesize a library of 1,5-disubstituted tetrazoles. (B) Components used in Ugi-azide reaction for library synthesis. (C) Structures of representative library members highlighting diazirine and alkyne groups for protein photocrosslinking and ligation of reporter tags to probe-bound targets, respectively. Also see Figure S1 for a complete list of probe structures.
Figure 2
Figure 2
Gel-based profiles of in situ protein labeling events of PC3 cells treated with fully functionalized probes. (A) Gel profiles for representative probes (10 μM) incubated with PC3 cells for 30 min prior to UV light exposure (10 min), lysis, conjugation to an Rh–N3 reporter tag by CuAAC, and analysis by SDS-PAGE and fluorescence scanning. Shown are soluble PC3 proteomes; see Figure S2 for gel profiles of additional probes and membrane proteomes of PC3 cells. (B) PC3 cell gel-based profiles of probes selected for in-depth MS studies.
Figure 3
Figure 3
Quantitative proteomic data for representative targets of the probe library. (A) SILAC plots for total proteins identified in experiments comparing cells treated with test probe (8, 22, 24, 26, 31, and 55) versus 3 (10 μM probes, 30 min). Proteins with median SILAC ratios ≥3 (test probe/3) are designated as preferred targets of the test probe (red dashed line marks 3-fold enrichment). Results are a combination of duplicate proteomic experiments performed in PC3 cells. See Table S1 for full proteomic data sets. (B) Representative MS1 peptide traces for protein targets of probes 24 (PEBP1) and 31 (CUTA) in experiments comparing the test probes to probe 3 (“probe vs 3”), to no-UV-light controls (“no UV”), and to themselves (“probe vs probe”). SILAC ratios ≥20 are reported as 20. SILAC ratios are shown as heavy:light.
Figure 4
Figure 4
Frequency of detection of probe targets in the CRAPome database (http://www.crapome.org/). Targets show a broad distribution of detection frequencies, indicating that they span a wide range of abundances in human cells.
Figure 5
Figure 5
Probe–protein interaction profiles. (A) Heat map showing enrichment ratios for various probe–protein interactions as determined by quantitative proteomic experiments in PC3 cells comparing test probes to probe 3. (B) Recombinantly expressed (recom) and endogenous (endog) forms of CUTA and PEBP1 show similar probe-interaction profiles in cells. Recombinant, Myc-tagged proteins were assayed for probe labeling in transiently transfected HEK293T cells and the profiles compared to those of mock-transfected cells.
Figure 6
Figure 6
Blockade of probe–protein interactions in cells by nonclickable competitor analogues. (A) Structure of probes 24 and 31 and their nonclickable competitor agents 60 and 64, respectively. (B) SILAC plots for total proteins identified in experiments comparing PC3 cells treated with test probe 31 (10 μM) and either 2× competitor 64 (20 μM, heavy cells), or DMSO (light). Red dashed line marks a light:heavy ratio of 0.5; protein ratios at or below this line indicate substantial competition. See Figure S5 and Table S2 for competition data for additional probes. (C) Representative MS1 peptide traces for protein targets of probes 24 (PEBP1) and 31 (CUTA) in competition experiments with 2× competitor (60 and 64, respectively). (D) Comparison of enrichment ratios for representative targets in test probe-versus-3 and test probe-versus-competitor experiments. A good correlation is observed between the test probe showing the highest target enrichment and the corresponding nonclickable analogue showing the highest competition (depicted using the inverse of the competition ratio shown in panel B and Figure S5) of target–probe interactions.

References

    1. Swinney D. C.; Anthony J. Nat. Rev. Drug. Discovery 2011, 10, 507. - PubMed
    1. Smukste I.; Stockwell B. R. Annu. Rev. Genom. Hum. Genet. 2005, 6, 261. - PubMed
    1. Burdine L.; Kodadek T. Chem. Biol. 2004, 11, 593. - PubMed
    1. Leslie B. J.; Hergenrother P. J. Chem. Soc. Rev. 2008, 37, 1347. - PubMed
    1. Li J.; Cisar J. S.; Zhou C. Y.; Vera B.; Williams H.; Rodriguez A. D.; Cravatt B. F.; Romo D. Nat. Chem. 2013, 5, 510. - PMC - PubMed

Publication types

MeSH terms