. 2014 Sep;10(9):1666-80.
doi: 10.4161/auto.29557. Epub 2014 Jul 16.

Autophagy-inducing peptides from mammalian VSV and fish VHSV rhabdoviral G glycoproteins (G) as models for the development of new therapeutic molecules

Affiliations

Autophagy-inducing peptides from mammalian VSV and fish VHSV rhabdoviral G glycoproteins (G) as models for the development of new therapeutic molecules

Pablo García-Valtanen et al. Autophagy. 2014 Sep.

Abstract

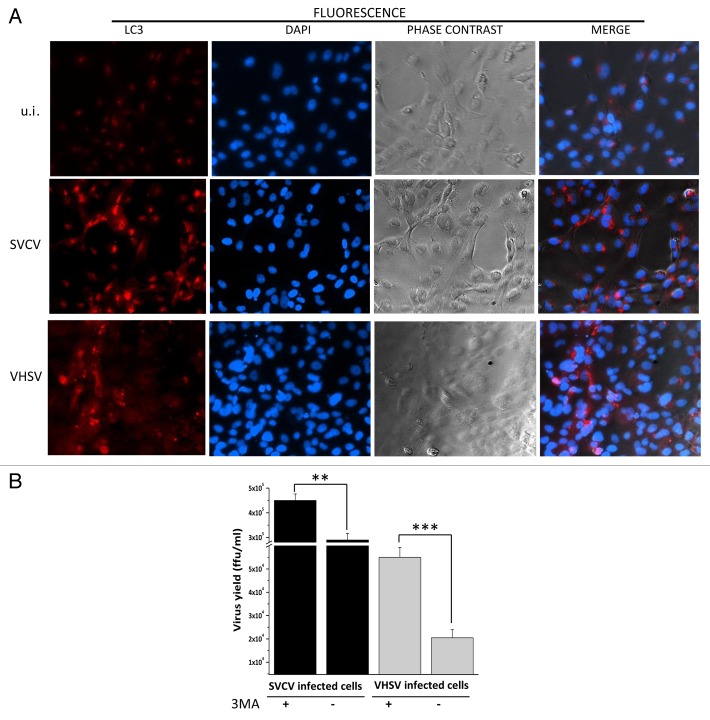
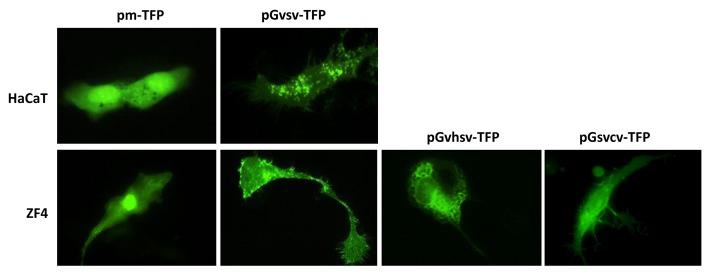
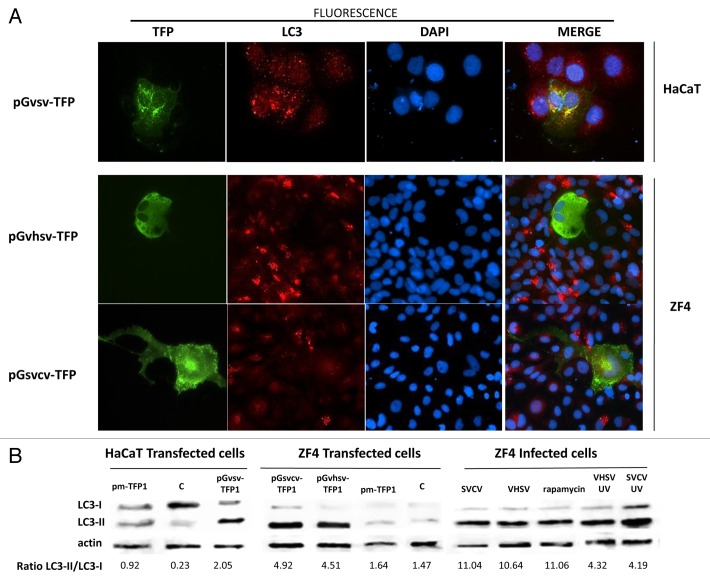
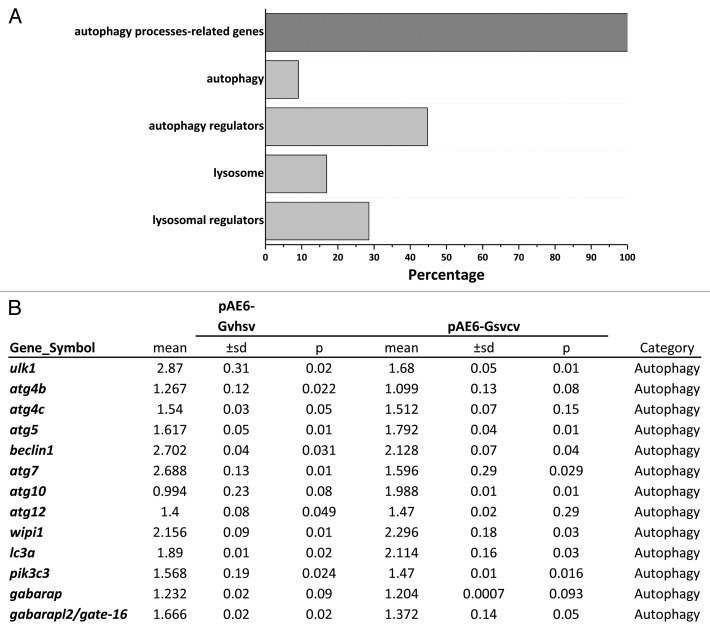
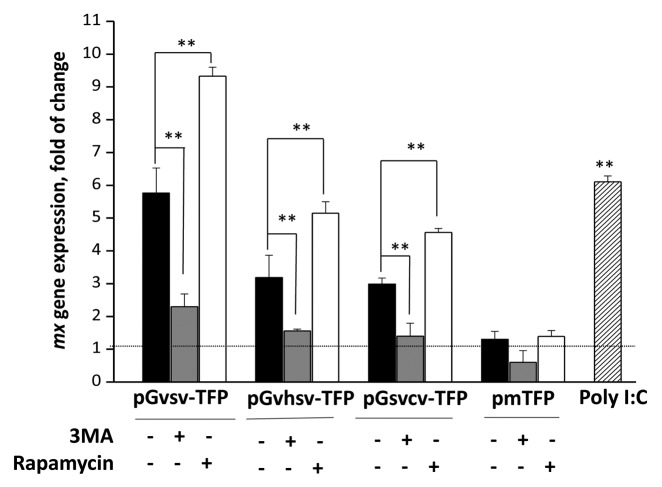
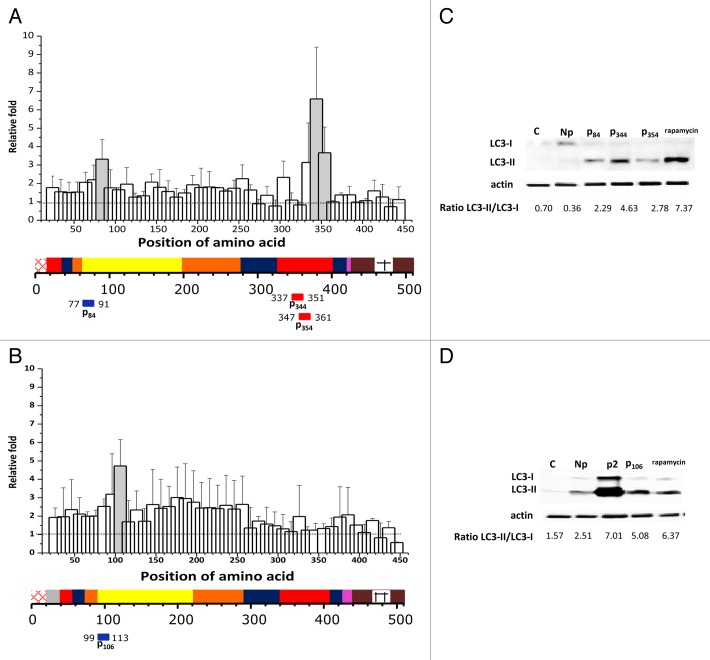
It has not been elucidated whether or not autophagy is induced by rhabdoviral G glycoproteins (G) in vertebrate organisms for which rhabdovirus infection is lethal. Our work provides the first evidence that both mammalian (vesicular stomatitis virus, VSV) and fish (viral hemorrhagic septicemia virus, VHSV, and spring viremia carp virus, SVCV) rhabdoviral Gs induce an autophagic antiviral program in vertebrate cell lines. The transcriptomic profiles obtained from zebrafish genetically immunized with either Gsvcv or Gvhsv suggest that autophagy is induced shortly after immunization and therefore, it may be an important component of the strong antiviral immune responses elicited by these viral proteins. Pepscan mapping of autophagy-inducing linear determinants of Gvhsv and Gvsv showed that peptides located in their fusion domains induce autophagy. Altogether these results suggest that strategies aimed at modulating autophagy could be used for the prevention and treatment of rhabdoviral infections such as rabies, which causes thousands of human deaths every year.

Keywords: LC3; SVCV; VHSV; VSV; antiviral; autophagy; immune response; microarrays; pepscan; rhabdovirus; viral glycoprotein; zebrafish.


Figures

None
Figure 1. Autophagy after fish rhabdoviral infection and its antiviral effect in zebrafish cells. (A) ZF4 cells were infected with either SVCV or VHSV (moi = 1) or uninfected (u.i.) and fixed after 24 h. Cells were then incubated with an antibody anti-LC3 and stained with a fluorophore-conjugated secondary antibody (red fluorescence, LC3), and DAPI (blue, cell nuclei). Images are representative of the results obtained in 2 independent experiments (B) Titration in EPC cells of virus in ffu/mL recovered from cell culture media of ZF4 cells with or without 3MA (10 mM) pretreatment and then infected with either SVCV (black bars) or VHSV (gray bars) (both at moi = 2). Results represent the mean ± SD of 2 independent experiments each performed in duplicate. ** and ***, Statistically significant (P ≤ 0.05 and P ≤ 0.01, respectively).
None
Figure 2. Expression of G-TFP fusion proteins in fish and mammalian cells. HaCaT or ZF4 cells were transfected with 1 μg/mL of pmTFP, pGvsv-TFP, pGvhsv-TFP, or pGsvcv-TFP and then viewed and photographed with an inverted fluorescence microscope 48 h post-transfection.
None
Figure 3. Rhabdoviral G-mediated autophagy in cells transfected with pm-TFP, pGvsv-TFP, pGvhsv-TFP or pGsvcv-TFP (A) and LC3-II/LC3-I ratios in virus infected and G-transfected cells. (A), cells were fixed at 72 h after transfection with 2.5 μg/mL of pGvsv-TFP (HaCaT cells) or 0.5 μg/mL of either pGvhsv-TFP or pGsvcv-TFP (ZF4 cells), for LC3 staining with an antibody anti-LC3 and fluorescent visualization. (B) Whole cell lysates were obtained from cells transfected (as above) or infected with SVCV, VHSV, or UV irradiated viruses (SVCV-UV, VHSV-UV) at moi = 20 for 4 h, cells treated with 500 nM of rapamycin (4 h) or untreated cells (control, C). LC3-I and LC3-II bands were visualized by WB using an anti-LC3 antibody, and the protein content of the stained bands estimated by densitometry, densitometry values were used to calculate LC3-II/ LC3-I ratios. Additionally, as a protein load internal control, actin bands were visualized using an anti-actin antibody. Results are representative of 2 independent experiments.
None
Figure 4. Expression of genes related to autophagy by microarray hybridization obtained from adult zebrafish genetically immunized by intramuscular injection with pAE6, pAE6-Gvhsv, or pAE6-Gsvcv. Three d post-immunization, muscle samples of zebrafish intramuscularly injected with 1.5 μg of the plasmids were processed to obtain their gene expression profiles using commercially available whole-genome DNA oligo microarrays from Agilent. Autophagy-related genes differentially expressed were sub-categorized (A). The expression fold values of the genes in the sub-category autophagy, are tabulated (B). Gene expression values were calculated by normalizing them against pAE6-injected fish. Means and standard deviations (S.D.) were calculated from 3 independent experiments. Threshold for statistical significance was established at P ≤ 0.05.
None
Figure 5. Modulation of mx mediated by G-induced autophagy. ZF4 cells were transfected with 0.5 μg/mL of pGvsv-TFP, pGvhsv-TFP, pGsvcv-TFP, or pmTFP. Four hours post-transfection, the media were removed and replaced by fresh cell culture media or media containing 10 mM of 3MA or 500 nM of rapamycin. Media were renewed after 24 h. At 48 h cells were harvested for RNA isolation and the transcript abundance of mx was analyzed by RTqPCR and calculated with the 2−ΔΔCt method, using eef1a1l1 (eukaryotic translation elongation factor 1 α, like 1) as endogenous control. Bars represent the mean expression ± SD of 2 independent experiments. **Statistically significant (P ≤ 0.05). Dotted line, expression levels of untransfected control cells.
None
Figure 6. Relative fold changes in LC3 protein expression in response to VSV and VHSV G pepscan peptide assayed by flow cytometry and immunoblot analysis of selected peptides. (A and B) Cells grown in 24-well plates, were incubated with 25 µg/mL of each of the peptides from the Gvsv and Gvhsv pepscans of 15-mer peptides. After 24 h of incubation, LC3 protein expression was measured by flow cytometry using an anti-LC3 antibody. Fold increases were calculated relative to untreated cells. Data represented are the mean fold ± SD from 2 independent experiments, each performed in duplicate. Grey bars represent pepscan peptides that induced significant changes in LC3 protein expression at P ≤ 0.05. Dotted lines indicate expression levels of untreated cells. Sequences of Gvsv and Gvhsv are represented colored by domains.- Signal peptide (red checkerboard), DI (lateral domain, red); DII (trimerization domain, blue); DIII (PH domain, orange); DIV (fusion domain, yellow); Cter (Cterminal, magenta); unobserved Cter (brown), with TM (black checkerboard). (C and D) Representative blots of ZF4 and HaCaT cells treated with the selected G peptides from VSV (P84, P344, P354) and VHSV (P106) and p2 (Gvhsv PS- and phosphatidylinositol bisphosphate-binding peptide). Cells were treated with 25 µg/mL of the peptides for 24 h, rapamycin (positive control), and a negative control peptide (Np), as a negative control. The transferred proteins were stained with anti-LC3 antibody. LC3-II/LC3-I ratios were calculated by densitometry and their values indicated below the blots.
None
Figure 7. Antiviral effect of autophagy-inducing peptides in ZF4 cells. Titration of virus (in ffu/mL) recovered from cell culture media from ZF4 cells treated with 12 (white bars), 25 (gray bars) and 50 (black bars) µg/mL of autophagy-inducing peptides from VSV or VHSV Gs, a negative peptide (Np) or untreated and then infected with VHSV (A) or SVCV (B). The results represent the mean ± SD of 2 independent experiments each performed in duplicate. *, Statistically significant (P ≤ 0.05), peptide treated vs. untreated cells.

Similar articles

Cited by

References

    1. Levine B, Klionsky DJ. Development by self-digestion: molecular mechanisms and biological functions of autophagy. Dev Cell. 2004;6:463–77. doi: 10.1016/S1534-5807(04)00099-1. - DOI - PubMed
    1. Ravikumar B, Futter M, Jahreiss L, Korolchuk VI, Lichtenberg M, Luo S, Massey DC, Menzies FM, Narayanan U, Renna M, et al. Mammalian macroautophagy at a glance. J Cell Sci. 2009;122:1707–11. doi: 10.1242/jcs.031773. - DOI - PMC - PubMed
    1. Choi AM, Ryter SW, Levine B. Autophagy in human health and disease. N Engl J Med. 2013;368:651–62. doi: 10.1056/NEJMra1205406. - DOI - PubMed
    1. Klionsky DJ, Baehrecke EH, Brumell JH, Chu CT, Codogno P, Cuervo AM, et al. A comprehensive glossary of autophagy-related molecules and processes (2nd edition). Autophagy 2011; 7:1273-94. - PMC - PubMed
    1. Tovilovic G, Ristic B, Milenkovic M, Stanojevic M, Trajkovic V. The role and therapeutic potential of autophagy modulation in controlling virus-induced cell death. Med Res Rev. 2014;34:744–67. doi: 10.1002/med.21303. - DOI - PubMed

Publication types