. 2014 Sep;10(9):1588-602.
doi: 10.4161/auto.29411. Epub 2014 Jul 10.

Role of VAMP3 and VAMP7 in the commitment of Yersinia pseudotuberculosis to LC3-associated pathways involving single- or double-membrane vacuoles

Affiliations

Role of VAMP3 and VAMP7 in the commitment of Yersinia pseudotuberculosis to LC3-associated pathways involving single- or double-membrane vacuoles

Laure-Anne Ligeon et al. Autophagy. 2014 Sep.

Abstract

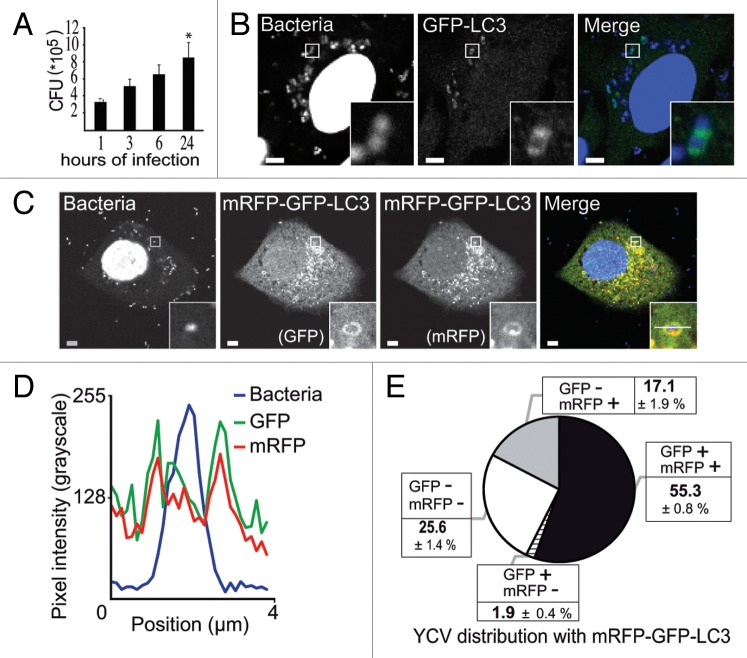
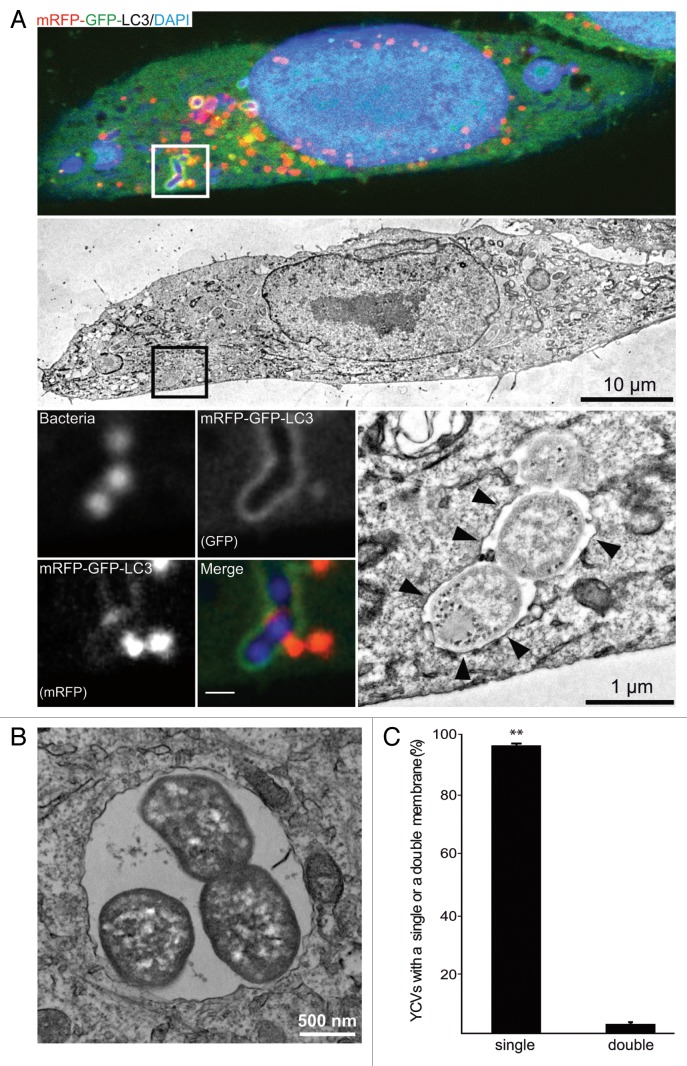
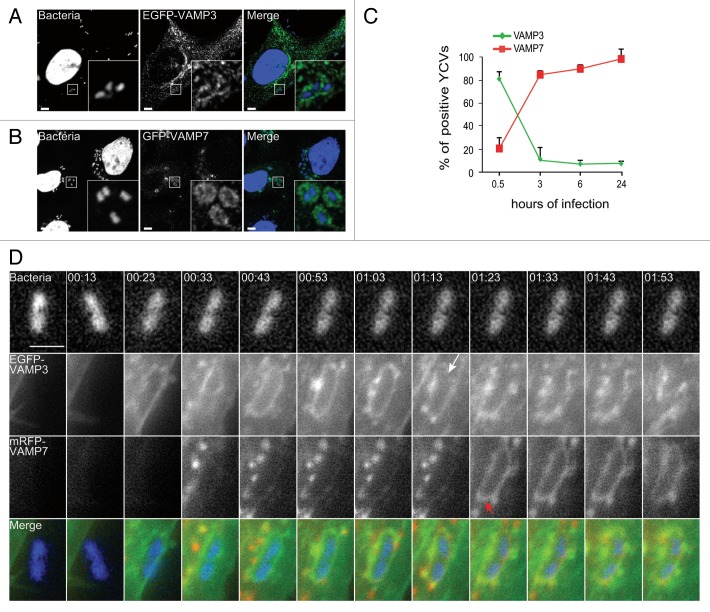
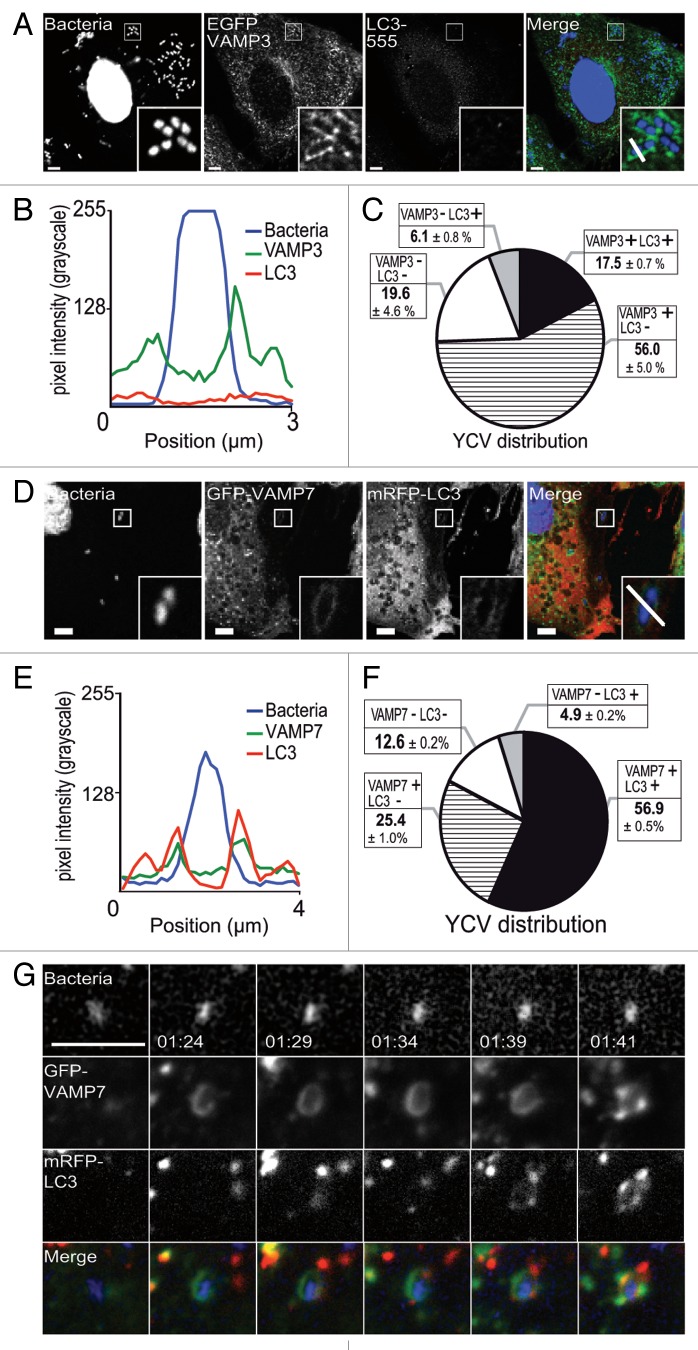
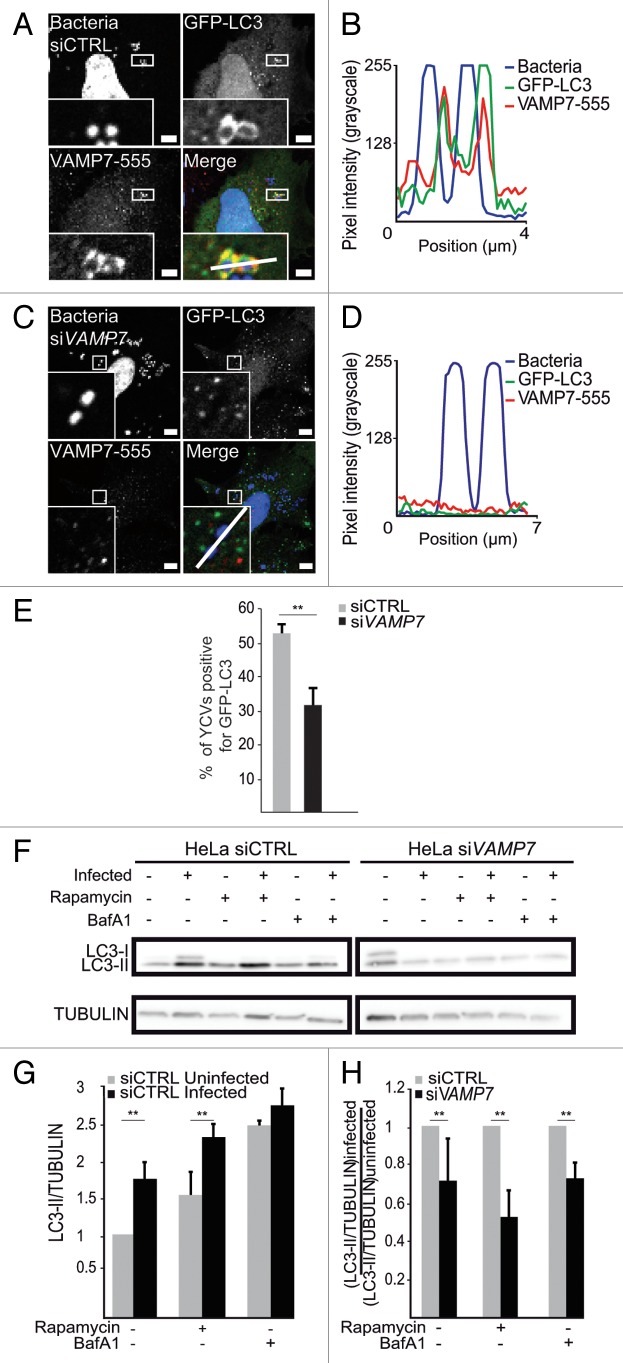
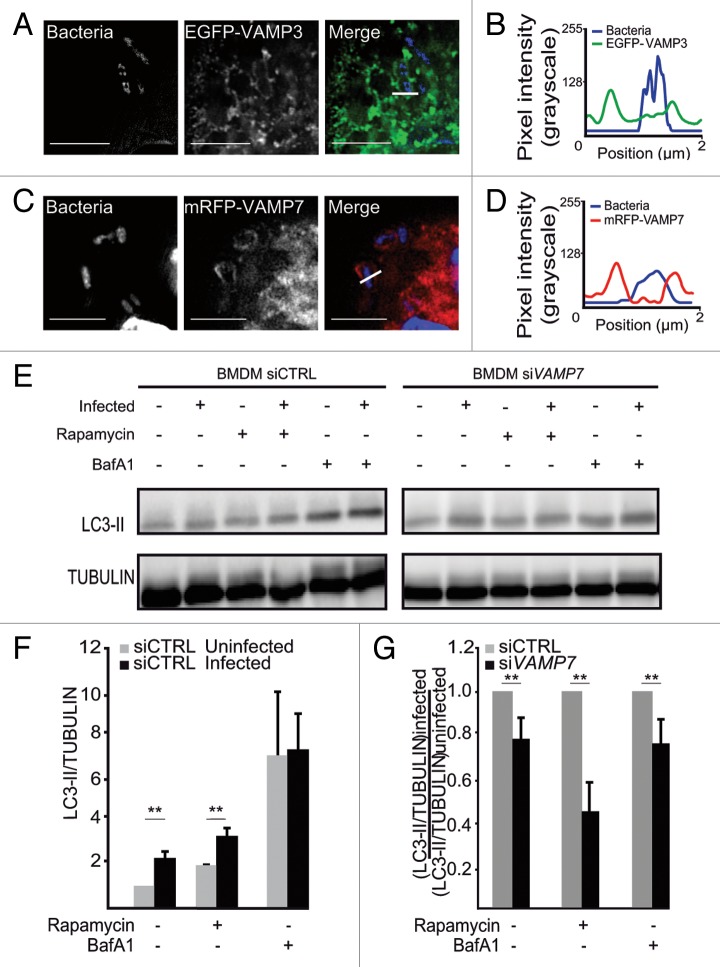
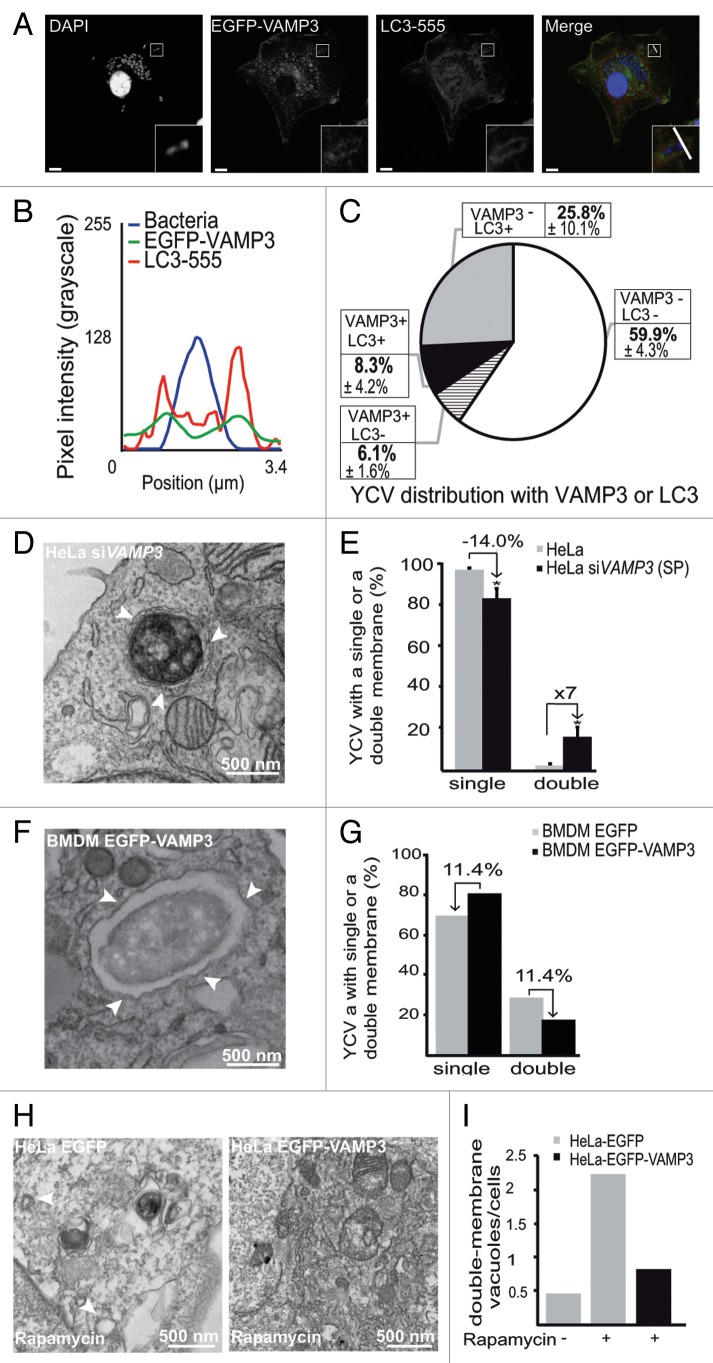
Yersinia pseudotuberculosis can replicate inside macrophages by hijacking autophagy and blocking autophagosome acidification. In bone marrow-derived macrophages, the bacteria are mainly observed inside double-membrane vacuoles positive for LC3, a hallmark of autophagy. Here, we address the question of the membrane traffic during internalization of Yersinia investigating the role of vesicle- associated membrane proteins (VAMPs). First, we show that as in epithelial cells, Yersinia pseudotuberculosis replicates mainly in nonacidic LC3-positive vacuoles. Second, in these cells, we unexpectedly found that VAMP3 localizes preferentially to Yersinia-containing vacuoles (YCVs) with single membranes using correlative light-electron microscopy. Third, we reveal the precise kinetics of VAMP3 and VAMP7 association with YCVs positive for LC3. Fourth, we show that VAMP7 knockdown alters LC3's association with single-and multimembrane-YCVs. Finally, in uninfected epithelial cells stimulated for autophagy, VAMP3 overexpression and knockdown led respectively to a lower and higher number of double-membrane, LC3-positive vesicles. Hence, our results highlight the role that VAMPs play in selection of the pathways leading to generation of ultrastructurally different LC3 compartments and pave the way for determining the full set of docking and fusion proteins involved in Yersinia pseudotuberculosis' intravesicular life cycle.

Keywords: LC3-associated phagosome; SNARE; VAMP3; VAMP7; Yersinia pseudotuberculosis; autophagy; correlative light-electron microscopy.


Figures

None
Figure 1.Yersinia pseudotuberculosis resides in nonacidic, LC3-positive compartments. (A) Intracellular replication of Y. pseudotuberculosis inside HeLa cells. Colonies were counted 1, 3, 6, and 24 h after infection. Data represent the mean ± SEM of 3 independent experiments. (B) HeLa cells transiently expressing GFP-LC3 were infected with wild-type Y. pseudotuberculosis for 4 h and processed for CLSM. Bacteria were visualized after staining with DAPI. The insert shows bacteria inside a LC3-positive vacuole. Scale bars: 5 µm. Insert magnification: 5×. (C) Bacteria contained in LC3-vacuoles do not reach an acidified compartment. HeLa stably expressing mRFP-GFP-LC3 were infected with Y. pseudotuberculosis for 4 h and processed for CLSM. Bacteria were visualized after staining with DAPI. The insert shows a bacterium inside an mRFP-GFP-LC3 vacuole. Scale bars: 5 µm. Insert magnification: 5×. The fluorescence profile along the white line in the image insert is shown in the lower left corner (D). (E) The distribution of bacteria is plotted as a function of GFP-LC3 and mRFP-LC3 labeling. In each experiment, at least 50 cells infected by Y. pseudotuberculosis during 4 h were quantified in a double-blind analysis. Data are displayed as the mean ± SEM from at least 3 independent experiments.
None
Figure 2.Yersinia pseudotuberculosis is contained within single-membrane, nonacidic, LC3-positive vacuoles. (A) HeLa cells stably expressing mRFP-GFP-LC3 were infected with Y. pseudotuberculosis for 4 h and then processed for CLEM. Bacteria were visualized after staining with DAPI. The upper panel shows a single HeLa cell observed by CLSM and the middle panel shows the corresponding TEM image. The lower left images show bacteria inside an mRFP-GFP-LC3 vacuole (insert magnification: 8×). The lower right image shows bacteria contained inside a single-membrane vacuole (arrowheads). (B) Bacteria dividing inside a single-membrane vacuole, as visualized by TEM. HeLa cells stably expressing mRFP-GFP-LC3 were infected with Y. pseudotuberculosis for 4 h and then processed for electron microscopy. (C) A quantitative TEM analysis of YCVs with single or double membranes. Values are quoted as the mean ± SEM from 3 independent experiments in which at least 20 HeLa cells stably expressing mRFP-GFP-LC3 were analyzed.
None
Figure 3. VAMP3 and VAMP7 associate with YCVs. (A) HeLa cells transiently expressing an EGFP-VAMP3 chimera were infected with Y. pseudotuberculosis for 45 min and then processed for CLSM. Bacteria (blue) are contained in EGFP-VAMP3-positive vacuoles. Scale bar: 5 µm. Insert magnification: 5×. (B) HeLa cells transiently expressing a GFP-VAMP7 chimera were infected with Y. pseudotuberculosis for 4 h and then processed for CLSM. Bacteria (blue) are contained in mRFP-VAMP7-positive vacuoles. Scale bar: 5 µm. Insert magnification: 5×. (C) A time-series acquisition of VAMP3 and VAMP7 proteins on YCVs during infection. Data represent average percentages of YCVs positive for the considered protein (in 3 independent experiments and after the analysis of 50 transfected, infected cells per experiment). (D) HeLa cells transiently expressing EGFP-VAMP3 (green) and mRFP-VAMP7 (red) were infected for 3 h and 33 min with Y. pseudotuberculosis. Bacteria were stained with DAPI (DNA, blue). Panels show series of images from Video S1 showing the migration of EGFP-VAMP3 and mRFP-VAMP7 proteins around a YCV. The white arrow indicates dissociation of VAMP3 from the YCV. Red arrows indicate VAMP7 vesicles heading to fusion with the YCV. At 1:23, the YCV displays VAMP7 on its surface as a result of these fusions. Acquisition times are indicated in the lower left corner (h:min). Scale bar: 5 µm.
None
Figure 4. YCV vacuoles harbor LC3 and SNARE proteins. (A) HeLa cells transiently expressing an EGFP-VAMP3 chimera were infected with Y. pseudotuberculosis for 30 min and then processed for CLSM. Bacteria (blue) are contained within EGFP-VAMP3-positive and LC3-AlexaFluor® 555-negative vacuoles. Scale bar: 5 µm. Insert magnification: 4×. A fluorescence scan along the white line in the insert in the merged panel is shown in (B). (C) A pie chart displaying the distribution of bacteria as a function of EGFP-VAMP3 and LC3-AlexaFluor® 555 labeling. In each experiment, at least 50 infected cells were quantified in a double-blind analysis. Values are quoted as the mean ± SEM from at least 3 independent experiments. (D) HeLa cells transiently expressing GFP-VAMP7 proteins were infected with Y. pseudotuberculosis for 4 h and then processed for CLSM. Bacteria (blue) are contained in GFP-VAMP7-positive and mRFP-LC3 negative vacuoles. Scale bar: 5 µm. Insert magnification: 4×. A fluorescence scan along the white line in the insert is shown at the bottom (E). (F) A pie chart displaying the distribution of bacteria as a function of GFP-VAMP7 and mRFP-LC3 labeling. In each experiment, at least 50 infected cells were quantified in a double-blind analysis. Values are quoted as the mean ± SEM from at least 3 independent experiments. (G) HeLa cells transiently expressing GFP-VAMP7 (green) and mRFP-LC3 (red) were infected with Y. pseudotuberculosis for 2 h. Cells were stained with DAPI (DNA, blue). Panels show series of images from Video S2. Acquisition times are indicated in the lower left corner (h:min). Scale bar: 5 µm.
None
Figure 5. VAMP7 has a role in the recruitment of LC3 to YCVs-LAP. (A) HeLa cells transiently expressing a GFP-LC3 chimera and treated with control siRNA (siCTRL) were infected with Y. pseudotuberculosis for 4 h and then processed for CLSM. VAMP7 proteins were immunostained and visualized with a secondary antibody coupled to AlexaFluor® 555. Bacteria (blue) are contained in GFP-LC3- (green) and VAMP7-AlexaFluor® 555- (red) positive vacuoles. Scale bar: 5 µm. Insert magnification: 4×. A fluorescence scan along the white line in the insert is shown in the right panel (B). (C) HeLa cells transiently expressing a GFP-LC3 chimera and treated with VAMP7 siRNA (siVAMP7) were infected with Y. pseudotuberculosis for 4 h and then processed for CLSM. VAMP7 proteins were immunostained and visualized with a secondary antibody coupled to AlexaFluor® 555 (red). Bacteria (blue) are contained in GFP-LC3-positive (green) and VAMP7-AlexaFluor® 555-negative vacuoles. Scale bar: 5 µm. Insert magnification: 5×. A fluorescence scan along the white line in the merged insert is shown on the right (D). (E) The percentages of YCVs displaying a GFP-LC3 labeling were quantified in HeLa cells treated or not with VAMP7 siRNA. In each experiment, at least 20 cells infected with Y. pseudotuberculosis during 4 h were quantified. (F) HeLa cells transfected with control or VAMP7 siRNA were analyzed for LC3 by immunoblotting. The cells were treated with rapamycin or BafA1 as indicated and DMSO was used as a solvent control. Protein loading was checked against the α-tubulin (TUBA) content. The complete data set is shown in Figure S2A. (G) The LC3-II/TUBULIN ratio for the HeLa siCTRL condition as a function of cell treatment or infection. The data correspond to the mean of 3 independent experiments and the error bars correspond to the SEM (H) VAMP7’s role in Yersinia-activated autophagy is shown by the [(LC3-II/TUBULIN)infected]/[(LC3-II/TUBULIN) uninfected] ratio for HeLa cells treated with control siRNA (siCTRL) or siRNA against VAMP7 (siVAMP7) and as a function of drug treatments. The data correspond to the mean of 3 independent experiments and the error bars correspond to the SEM.
None
Figure 6. VAMP3 and VAMP7 are recruited to YCVs in macrophages and VAMP7 is involved in LC3 recruitment. (A) BMDMs transiently expressing EGFP-VAMP3 were infected with Y. pseudotuberculosis for 30 min and then processed for super resolution fluorescence analysis (structured illumination microscopy- SIM). Bacteria were visualized after staining with DAPI. Scale bars: 5 µm. The fluorescence profile along the white line of the image insert is shown in the lower left corner (B). (C) BMDMs transiently expressing mRFP-VAMP7 were infected with Y. pseudotuberculosis for 3 h and then processed for SIM. Bacteria were visualized after staining with DAPI. Scale bars: 5 µm. The fluorescence profile along the white line in the image insert is shown at the bottom left (D). (E) BMDMs transfected with control (siCTRL) or VAMP7 siRNA were analyzed for LC3 by immunoblotting. The cells were treated with rapamycin or BafA1 as indicated and DMSO was used as a solvent control. Protein loading was checked against the α-tubulin (TUBA) content. The complete data set is shown in Figure S2D. (F) The LC3-II/TUBULIN ratio for BMDMs treated with control siRNA (siCTRL) as a function of cell treatment or infection. The mean of 3 independent experiments is indicated and the error bars correspond to the SEM (G) ([LC3-II/TUBULIN]infected)/([LC3-II/TUBULIN] uninfected) ratio in BMDMs treated with control siRNA (siCTRL) or siRNA against VAMP7 (siVAMP7) cells as a function of treatment with rapamycin or BafA1. The mean of 3 independent experiments is indicated and the error bars correspond to the SEM.
None
Figure 7. VAMP3 participates in the regulation of LC3-positive vacuole morphology. (A) BMDMs transiently expressing an EGFP-VAMP3 chimera were infected with Y. pseudotuberculosis for 30 min and then processed for CLSM. Bacteria (blue) are contained within EGFP-VAMP3-positive and LC3-AlexaFluor® 555-negative vacuoles. Scale bar: 5 µm and insert magnification 4×. A fluorescence scan along the white line on the insert in the merged panel is shown in (B). (C) A pie chart displaying the distribution of bacteria as a function of EGFP-VAMP3 and LC3-AlexaFluor® 555 labeling. In each experiment, at least 30 infected cells were quantified in a double-blind analysis. Values are quoted as the mean ± SEM from at least 3 independent experiments. (D) The panel shows a bacterium inside a double-membrane vacuole (as visualized by TEM) in a HeLa cell treated with VAMP3 siRNA (siVAMP3). HeLa cells were treated with VAMP3 siRNA and siGLO-GREEN siRNA, sorted according to the GFP signal, again treated with VAMP3 siRNA or siCTRL, infected with Y. pseudotuberculosis for 4 h, and then processed for TEM. Arrowheads show double-membrane vacuoles. (E) Quantification of YCVs with single or double membrane after 4 h p.i in HeLa cells treated with control siRNA (siCTRL), smart pool VAMP3 siRNA (siVAMP3 (SP)). For each experiment, 45 cells were analyzed. The mean of 3 independent experiments is indicated and the error bars correspond to the SEM (F) BMDMs transiently expressing EGFP-VAMP3 were infected with Y. pseudotuberculosis for 3 h and processed for TEM. Arrowheads show Y. pseudotuberculosis contained in a single-membrane vacuole. (G) TEM quantification of single- or double-membrane YCVs for 38 BMDMs transiently expressing EGFP-VAMP3 or EGFP. (H) HeLa cells transiently expressing EGFP (left) or EGFP-VAMP3 (right) were treated with rapamycin for 7 h and then processed for TEM. White arrowheads show double-membrane vacuoles. The complete data set is shown in Figure S3G. (I) Quantification of double-membrane vacuoles in HeLa cells transiently expressing EGFP or EGFP-VAMP3 and treated (or not) with rapamycin. In each experiment, at least 35 infected cells were quantified in a double-blind analysis.

Similar articles

Cited by

References

    1. Deretic V, Levine B. Autophagy, immunity, and microbial adaptations. Cell Host Microbe. 2009;5:527–49. doi: 10.1016/j.chom.2009.05.016. - DOI - PMC - PubMed
    1. Deretic V. Autophagy in immunity and cell-autonomous defense against intracellular microbes. Immunol Rev. 2011;240:92–104. doi: 10.1111/j.1600-065X.2010.00995.x. - DOI - PMC - PubMed
    1. Johansen T, Lamark T. Selective autophagy mediated by autophagic adapter proteins. Autophagy. 2011;7:279–96. doi: 10.4161/auto.7.3.14487. - DOI - PMC - PubMed
    1. Faure M, Lafont F. Pathogen-induced autophagy signaling in innate immunity. J Innate Immun. 2013;5:456–70. doi: 10.1159/000350918. - DOI - PMC - PubMed
    1. Yang Z, Klionsky DJ. Eaten alive: a history of macroautophagy. Nat Cell Biol. 2010;12:814–22. doi: 10.1038/ncb0910-814. - DOI - PMC - PubMed

Publication types

MeSH terms

LinkOut - more resources