. 2014 Sep;10(9):1565-78.
doi: 10.4161/auto.29397. Epub 2014 Jun 30.

Reciprocal conversion of Gtr1 and Gtr2 nucleotide-binding states by Npr2-Npr3 inactivates TORC1 and induces autophagy

Affiliations

Reciprocal conversion of Gtr1 and Gtr2 nucleotide-binding states by Npr2-Npr3 inactivates TORC1 and induces autophagy

Shintaro Kira et al. Autophagy. 2014 Sep.

Abstract

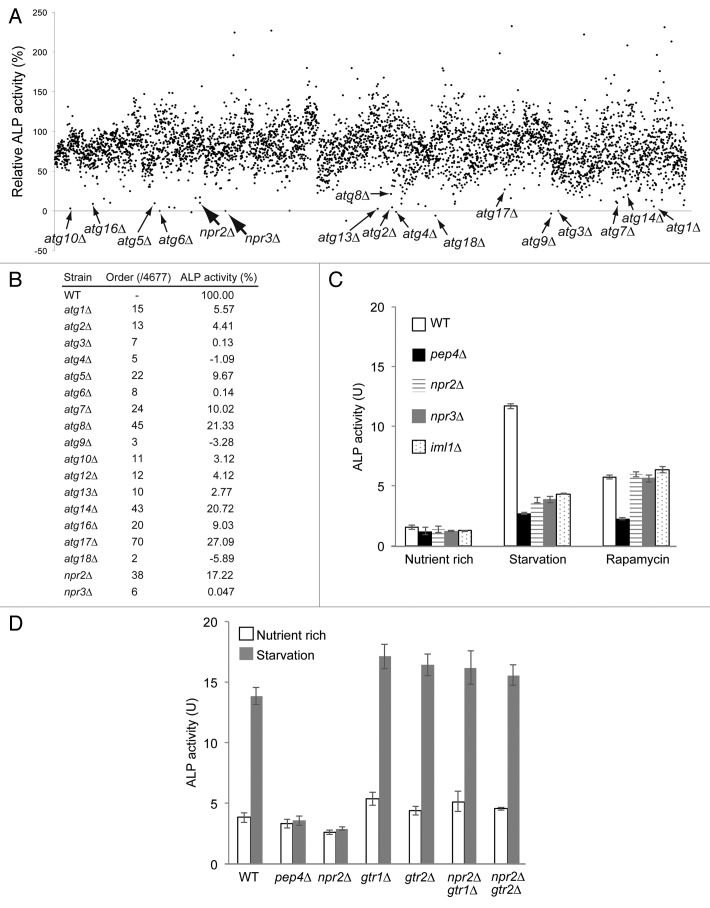
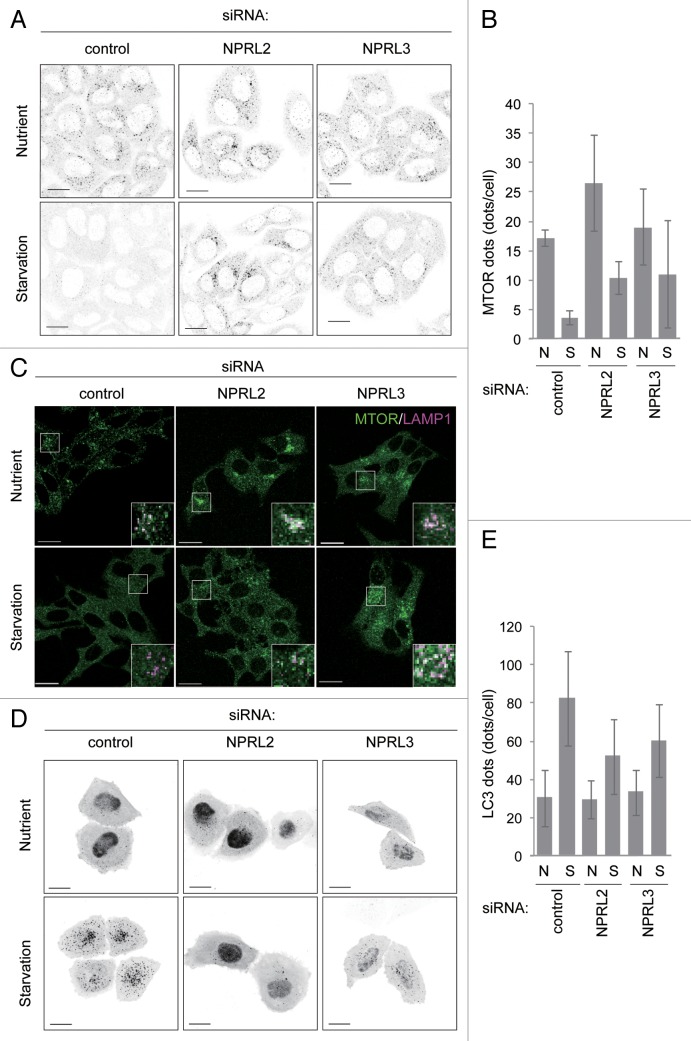
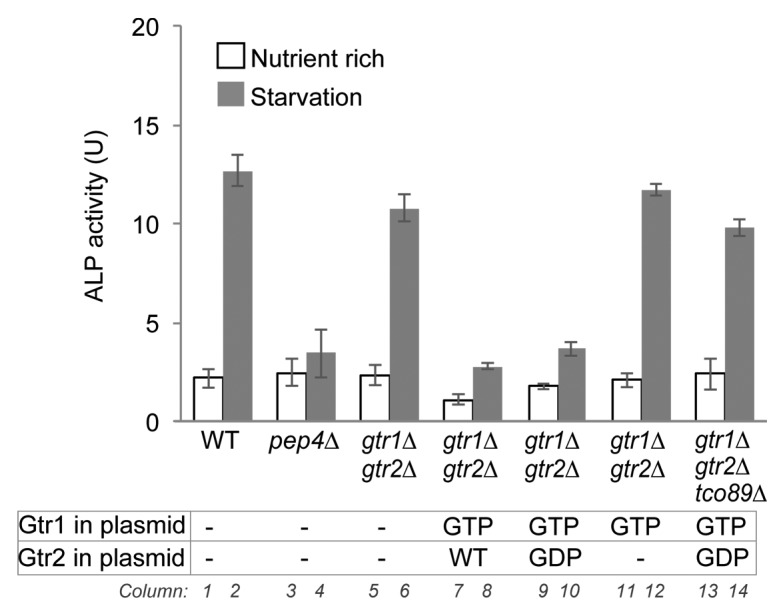
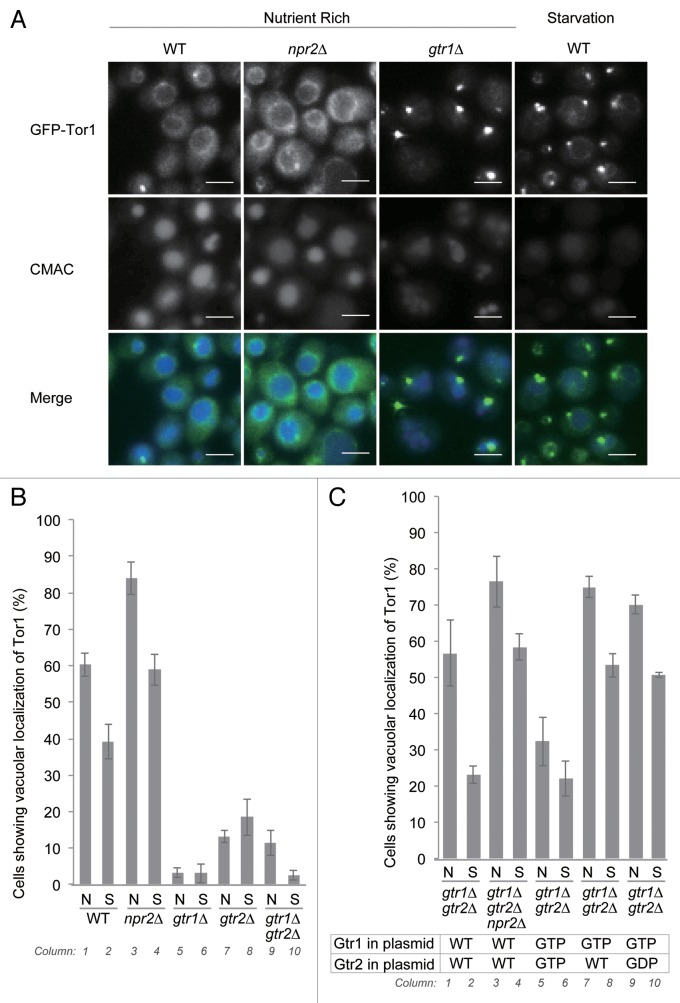
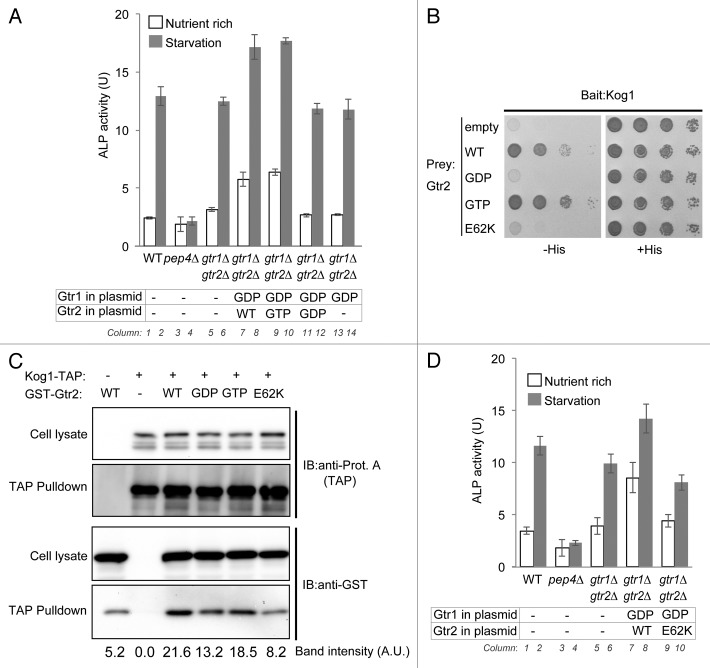
Autophagy is an intracellular degradation process that delivers cytosolic material to lysosomes and vacuoles. To investigate the mechanisms that regulate autophagy, we performed a genome-wide screen using a yeast deletion-mutant collection, and found that Npr2 and Npr3 mutants were defective in autophagy. Their mammalian homologs, NPRL2 and NPRL3, were also involved in regulation of autophagy. Npr2-Npr3 function upstream of Gtr1-Gtr2, homologs of the mammalian RRAG GTPase complex, which is crucial for TORC1 regulation. Both npr2∆ mutants and a GTP-bound Gtr1 mutant suppressed autophagy and increased Tor1 vacuole localization. Furthermore, Gtr2 binds to the TORC1 subunit Kog1. A GDP-bound Gtr1 mutant induced autophagy even under nutrient-rich conditions, and this effect was dependent on the direct binding of Gtr2 to Kog1. These results revealed that 2 molecular mechanisms, Npr2-Npr3-dependent GTP hydrolysis of Gtr1 and direct binding of Gtr2 to Kog1, are involved in TORC1 inactivation and autophagic induction.

Keywords: GTPase-activating protein; Gtr1; Gtr2; RAG; TORC1; autophagy.


Figures

None
Figure 1. Gtr1 contributes to the regulation of autophagy by Npr2-Npr3. (A) ALP activities in the mutant strains bearing pho860 after 4 h of starvation. Activity measured in the vacuolar proteinase A mutant strain pep4∆ (SKY001) was subtracted as the background signal. Activities are shown as the percentage values for each strain relative to that of the parental TNY509 strain. Deletion mutants lacking the core ATG genes, NPR2, or NPR3 are denoted with arrows. (B) Detailed ALP activities for representative atg mutants shown in (A). (C) ALP activities in the wild-type (SKY084), pep4∆ (SKY100), npr2∆ (SKY091), npr3∆ (SKY131), and iml1∆ (SKY264) strains. Before the cells were subjected to the ALP assay, the strains were incubated in YPD medium at log phase, under nitrogen starvation conditions for 3 h, or in the presence of rapamycin for 3 h. Data represent means ± standard deviation from 3 independent experiments. (D) Wild-type (BY4741, SKY084) and pep4∆ (SKY100), gtr1∆ (SKY244), gtr2∆ (SKY246), gtr1∆ npr2∆ (SKY245), gtr2∆ npr2∆ (SKY247) yeast cells were grown in YPD, starved for 3 h, and subjected to ALP assays. Data represent means ± standard deviation from 3 independent experiments.
None
Figure 2. Effects of knockdown of NPRL2 and NPRL3 expression on MTOR localization and autophagy. (A) Two and a half d after siRNA transfection (clone #1), HeLa cells were incubated in nutrient-rich growth medium or EBSS (starvation medium) for 1 h. Cells were immunostained with anti-MTOR antibodies and subjected to fluorescence microscopy. Scale bar: 20 μm. (B) MTOR-positive puncta (A) were counted in NPRL2- or NPRL3-knockdown HeLa cells using the G-count software. Data represent means ± standard deviation of representative results (n > 40 cells). (C) Effect of NPRL2 or NPRL3 knockdown on MTOR localization. Knockdown MCF7 cells were incubated in growth medium (serum, amino acid: +) or EBSS (serum, amino acid: -) for 60 min, and then stained with MTOR (green) and LAMP1 (magenta) antibodies. Bars indicate 20 μm. Results shown are from siRNA clone #1 for NPRL2 knockdown and clone #2 for NPRL3 knockdown. (D) HeLa cells were cotransfected with siRNA (clone #1) and a vector harboring EGFP-LC3. Two and a half d after siRNA transfection, cells incubated in growth medium or starvation medium for 1 h were subjected to fluorescence microscopy. Scale bars: 20 μm. (E) GFP-LC3-positive puncta in each cell from (D) were counted. Data represent means ± standard deviation of representative results (n > 40 cells).
None
Figure 3. A GTP-bound Gtr1 mutant suppresses autophagy in a Gtr2-dependent manner. gtr1∆ gtr2∆ double-deletion cells (SKY167) harboring empty vector (-), plasmid encoding GTP-bound mutant Gtr1 (GTP), and/or plasmid encoding wild-type (WT) or GDP-bound mutant Gtr2 (GDP) and tco89∆ gtr1∆ gtr2∆ triple-mutant cells (SKY277) expressing GTP-bound Gtr1 mutant (GTP) and GDP-bound Gtr2 mutant (GDP) were grown in SD medium containing 0.5% casamino acids, incubated under nitrogen-starvation conditions for 3 h, and then subjected to ALP assays. Data represent means ± standard deviation from 3 independent experiments. The ALP activities of wild-type (SKY084) and pep4∆ (SKY100) cells harboring empty vector were also measured as control samples.
None
Figure 4. Vacuolar localization of Tor1 is regulated by Gtr1, Gtr2, Npr2, and nutrient availability. (A) Strains expressing N-terminally GFP-tagged Tor1 under the control of the native promoter (WT, SKY222; npr2∆, SKY226; gtr1∆, SKY278; gtr2∆, SKY279; gtr1∆ gtr2∆, SKY299) were incubated in SD medium containing 0.5% casamino acids and 100 µM CMAC for 30 min, and either washed once with SD medium containing 0.5% casamino acids or starved for nitrogen (SD-N) for 1 to 2 h, and then subjected to fluorescence microscopy. Scale bar: 5 μm. (B) Percentage of cells in (A) exhibiting vacuolar localization of Tor1. Cells with GFP-Tor1 signals surrounding vacuoles stained by CMAC were counted. More than 100 cells were counted. Data represent means ± standard deviation from 3 independent experiments. (C) Strains expressing N-terminally GFP-tagged Tor1 (gtr1∆ gtr2∆, SKY299; gtr1∆ gtr2∆ npr2∆, SKY320) and expressing the indicated combinations of Gtr1 and Gtr2 mutants were subjected to fluorescence microscopy under the same conditions as in (A). Percentage of cells exhibiting vacuolar localization of Tor1 is presented in (B).
None
Figure 5. Gtr2 interacts with Kog1 and inactivates TORC1. (A) Wild-type (SKY084), pep4∆ (SKY100), and gtr1∆ gtr2∆ double-mutant cells harboring empty vector (-), and gtr1∆ gtr2∆ cells harboring the GDP-bound mutant Gtr1 (top row: GDP) along with wild-type, GTP-bound mutant, or GDP-bound mutant Gtr2 (bottom row: WT, GTP, and GDP, respectively), were either grown in SD medium supplemented with 0.5% casamino acids or starved of nitrogen for 3 h, and then subjected to ALP assays. Data represent means ± standard deviation from 3 independent experiments. (B) Cells of the strain for yeast 2-hybrid analysis (PJ69-4A) harboring pGBD-C1 vector encoding wild-type, GTP-bound mutant, GDP-bound mutant, or E62K mutant Gtr2 (pSK150, pSK151, pSK152, or pSK222, respectively) and pGAD-C1/Kog1 (pSK156) were serially 10-fold diluted and spotted onto SC medium plates either lacking histidine and leucine or histidine, leucine, and uracil. Results after 2 d of culture at 30 °C are shown. (C) Cells endogenously expressing TAP-tagged Kog1 and harboring multicopy vector encoding wild-type, GTP-bound mutant, GDP-bound mutant, or E62K mutant Gtr2 were subjected to TAP affinity isolation assays. The lysates and the affinity isolates were subjected to western blot analysis with anti-protein A and anti-GST antibodies. (D) Strains (wild-type, SKY084; pep4∆, SKY100; and gtr1∆ gtr2∆, SKY167) harboring empty vector (-), and gtr1∆ gtr2∆ (SKY167) harboring GDP-bound Gtr1 mutant (GDP) along wild-type (WT) or E62K mutant Gtr2E62K, were either grown in SD medium supplemented with 0.5% casamino acids or starved of nitrogen for 3 h, and then subjected to ALP assays. Data represent means ± standard deviation from 3 independent experiments.

References

    1. Mizushima N, Komatsu M. Autophagy: renovation of cells and tissues. Cell. 2011;147:728–41. doi: 10.1016/j.cell.2011.10.026. - DOI - PubMed
    1. Noda T, Ohsumi Y. Tor, a phosphatidylinositol kinase homologue, controls autophagy in yeast. J Biol Chem. 1998;273:3963–6. doi: 10.1074/jbc.273.7.3963. - DOI - PubMed
    1. Díaz-Troya S, Pérez-Pérez ME, Florencio FJ, Crespo JL. The role of TOR in autophagy regulation from yeast to plants and mammals. Autophagy. 2008;4:851–65. - PubMed
    1. Zoncu R, Efeyan A, Sabatini DM. mTOR: from growth signal integration to cancer, diabetes and ageing. Nat Rev Mol Cell Biol. 2011;12:21–35. doi: 10.1038/nrm3025. - DOI - PMC - PubMed
    1. Kamada Y, Yoshino K, Kondo C, Kawamata T, Oshiro N, Yonezawa K, Ohsumi Y. Tor directly controls the Atg1 kinase complex to regulate autophagy. Mol Cell Biol. 2010;30:1049–58. doi: 10.1128/MCB.01344-09. - DOI - PMC - PubMed

Publication types

MeSH terms

Substances