

Liver proteomic response to hypertriglyceridemia in human-apolipoprotein C-III transgenic mice at cellular and mitochondrial compartment levels
- PMID: 25047818
- PMCID: PMC4112841
- DOI: 10.1186/1476-511X-13-116
Liver proteomic response to hypertriglyceridemia in human-apolipoprotein C-III transgenic mice at cellular and mitochondrial compartment levels
Abstract
Background: Hypertriglyceridemia (HTG) is defined as a triglyceride (TG) plasma level exceeding 150 mg/dl and is tightly associated with atherosclerosis, metabolic syndrome, obesity, diabetes and acute pancreatitis. The present study was undertaken to investigate the mitochondrial, sub-mitochondrial and cellular proteomic impact of hypertriglyceridemia in the hepatocytes of hypertriglyceridemic transgenic mice (overexpressing the human apolipoproteinC-III).
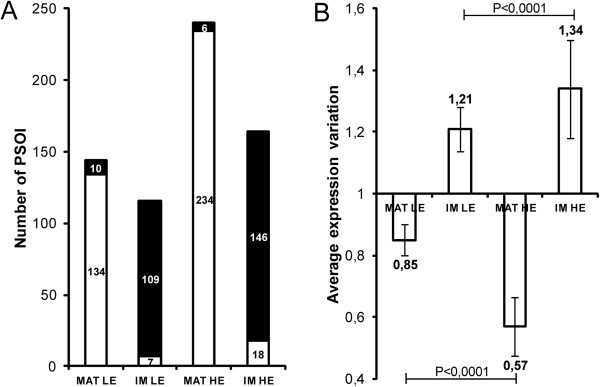
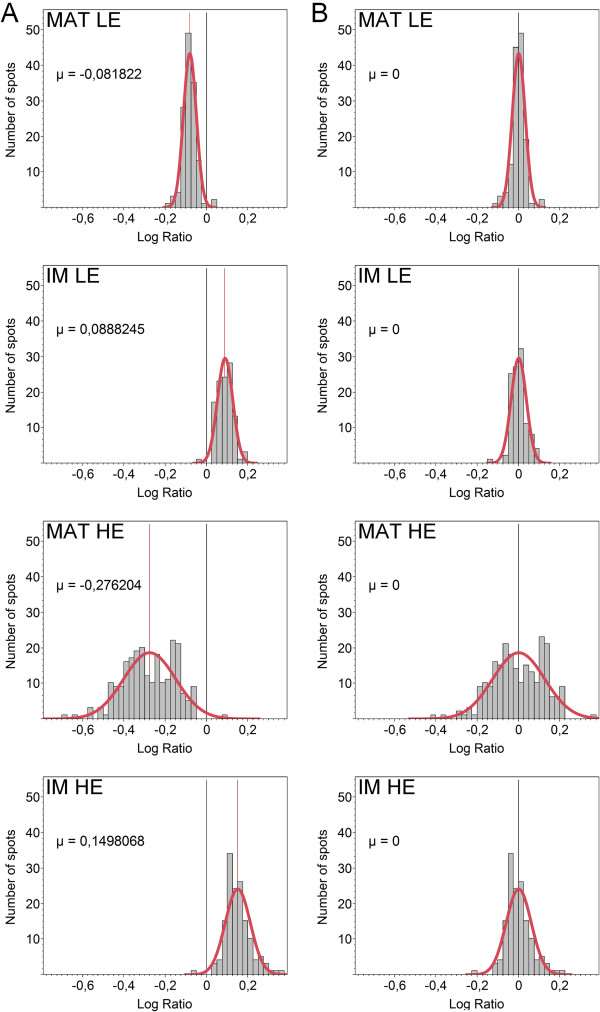
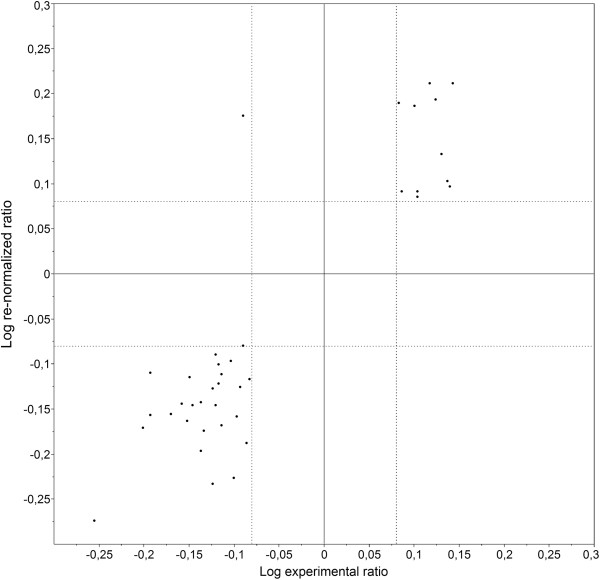
Methods: Quantitative proteomics (2D-DIGE) analysis was carried out on both "low-expressor" (LE) and "high-expressor" (HE) mice, respectively exhibiting moderate and severe HTG, to characterize the effect of the TG plasma level on the proteomic response.
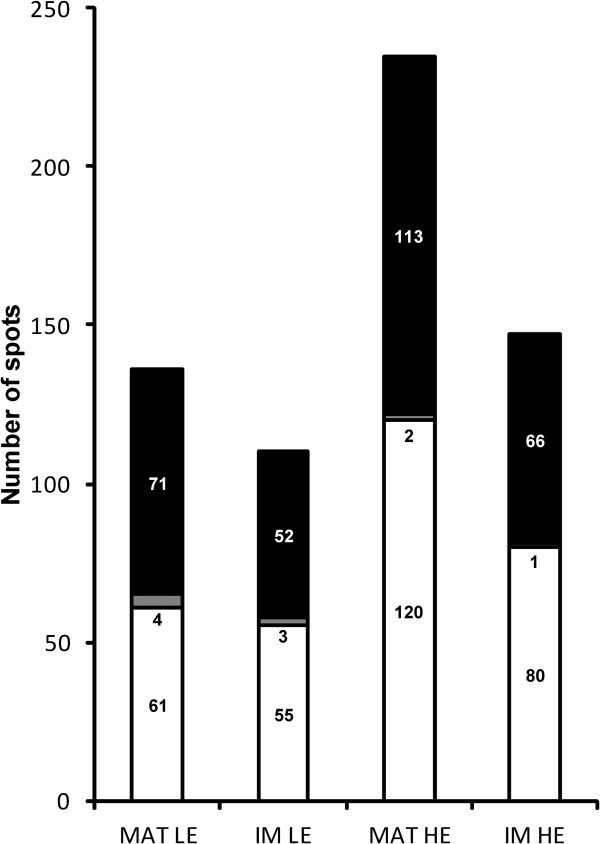
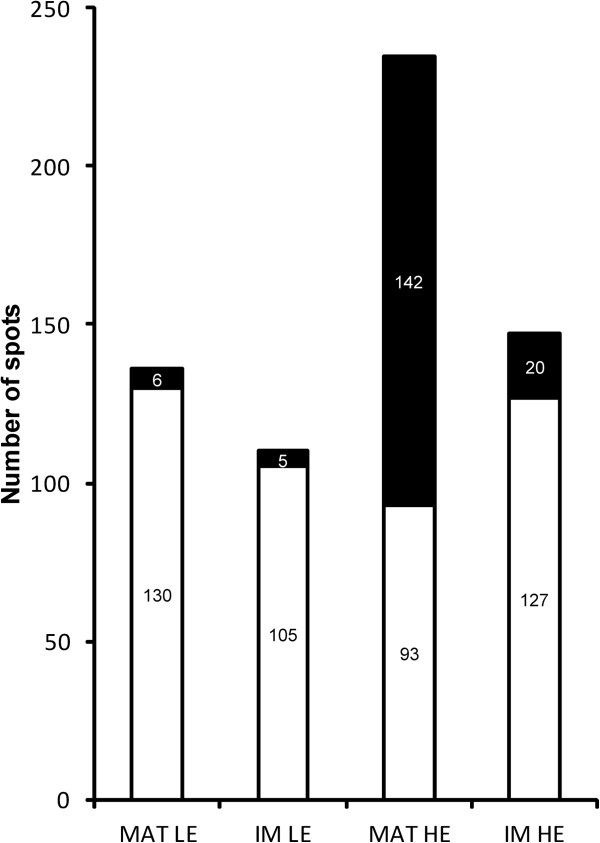
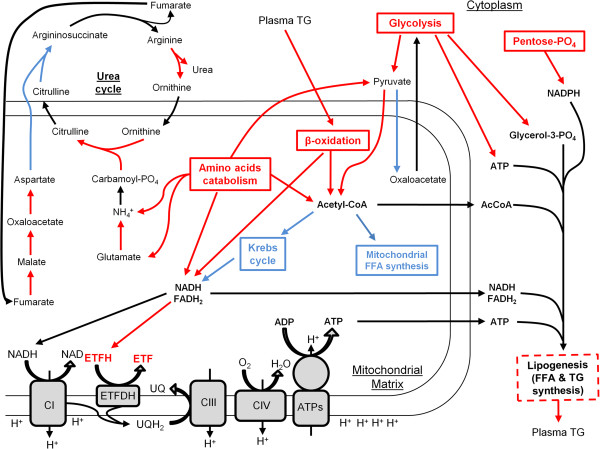
Results: The mitoproteome analysis has revealed a large-scale phenomenon in transgenic mice, i.e. a general down-regulation of matricial proteins and up-regulation of inner membrane proteins. These data also demonstrate that the magnitude of proteomic changes strongly depends on the TG plasma level. Our different analyses indicate that, in HE mice, the capacity of several metabolic pathways is altered to promote the availability of acetyl-CoA, glycerol-3-phosphate, ATP and NADPH for TG de novo biosynthesis. The up-regulation of several cytosolic ROS detoxifying enzymes has also been observed, suggesting that the cytoplasm of HTG mice is subjected to oxidative stress. Moreover, our results suggest that iron over-accumulation takes place in the cytosol of HE mice hepatocytes and may contribute to enhance oxidative stress and to promote cellular proliferation.
Conclusions: These results indicate that the metabolic response to HTG in human apolipoprotein C-III overexpressing mice may support a high TG production rate and that the cytosol of hepatocytes is subjected to an important oxidative stress, probably as a result of FFA over-accumulation, iron overload and enhanced activity of some ROS-producing catabolic enzymes.
Figures
References
-
- Grundy SM, Brewer HB Jr, Cleeman JI, Smith SC Jr, Lenfant C. Definition of metabolic syndrome: report of the national heart, lung, and blood institute/american heart association conference on scientific issues related to definition. Circulation. 2004;109:433–438. - PubMed
-
- Reid AE. Nonalcoholic steatohepatitis. Gastroenterology. 2001;121:710–723. - PubMed
-
- Toskes PP. Hyperlipidemic pancreatitis. Gastroenterol Clin North Am. 1990;19:783–791. - PubMed
-
- Ginsberg HN, Le NA, Goldberg IJ, Gibson JC, Rubinstein A, Wang-Iverson P, Norum R, Brown WV. Apolipoprotein B metabolism in subjects with deficiency of apolipoproteins CIII and AI. Evidence that apolipoprotein CIII inhibits catabolism of triglyceride-rich lipoproteins by lipoprotein lipase in vivo. J Clin Invest. 1986;78:1287–1295. - PMC - PubMed
-
- Maeda N, Li H, Lee D, Oliver P, Quarfordt SH, Osada J. Targeted disruption of the apolipoprotein C-III gene in mice results in hypotriglyceridemia and protection from postprandial hypertriglyceridemia. J Biol Chem. 1994;269:23610–23616. - PubMed
Publication types
MeSH terms
Substances
LinkOut - more resources
Full Text Sources
Other Literature Sources
Medical
Molecular Biology Databases
Miscellaneous
