. 2014 Dec;171(23):5387-406.
doi: 10.1111/bph.12850. Epub 2014 Sep 5.

Heteromerization of GPR55 and cannabinoid CB2 receptors modulates signalling

Affiliations

Heteromerization of GPR55 and cannabinoid CB2 receptors modulates signalling

N A Balenga et al. Br J Pharmacol. 2014 Dec.

Abstract

Background and purpose: Heteromerization of GPCRs is key to the integration of extracellular signals and the subsequent cell response via several mechanisms including heteromer-selective ligand binding, trafficking and/or downstream signalling. As the lysophosphatidylinositol GPCR 55 (GPR55) has been shown to affect the function of the cannabinoid receptor subtype 2 (CB2 receptor) in human neutrophils, we investigated the possible heteromerization of CB2 receptors with GPR55.

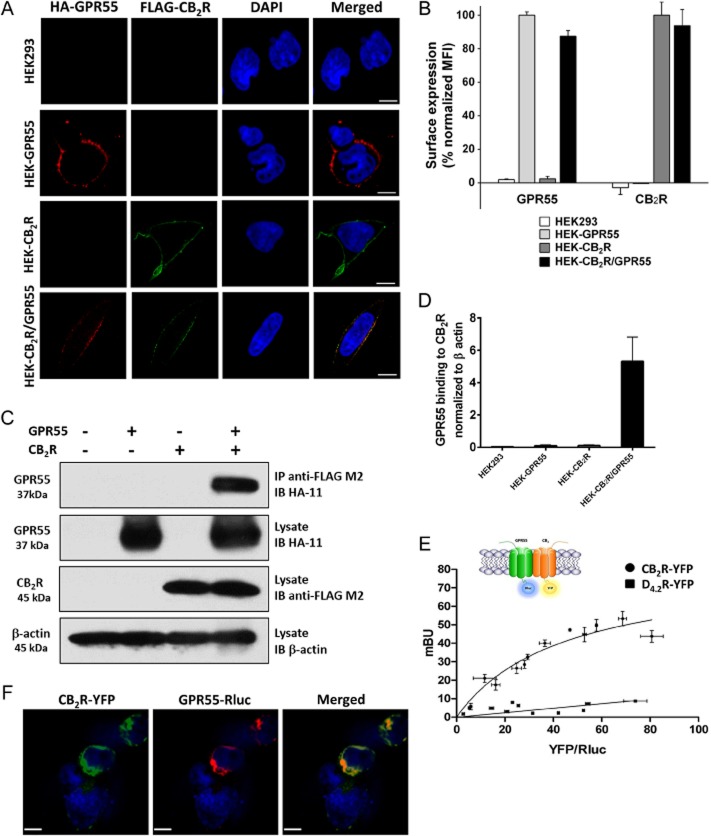
Experimental approach: The direct interaction of human GPR55 and CB2 receptors heterologously expressed in HEK293 cells was assessed by co-immunoprecipitation and bioluminescence resonance energy transfer assays. The effect of cross-talk on signalling was investigated at downstream levels by label-free real-time methods (Epic dynamic mass redistribution and CellKey impedance assays), ERK1/2-MAPK activation and gene reporter assays.

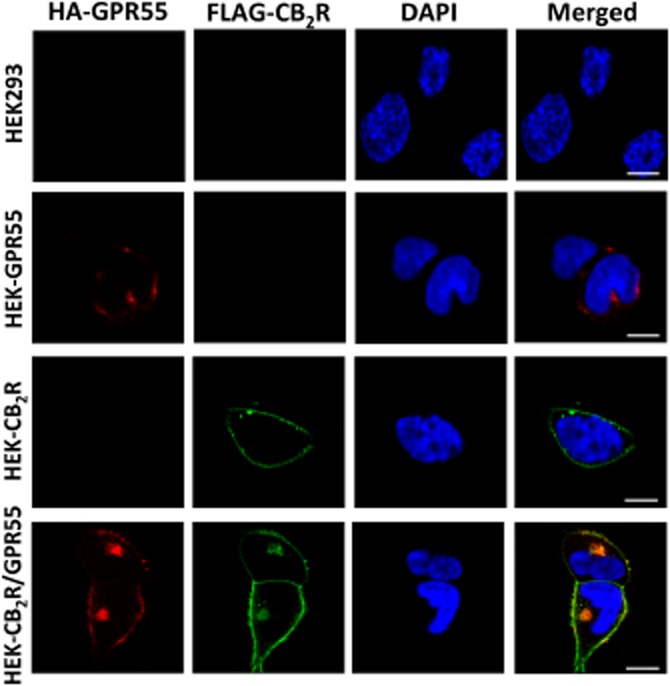
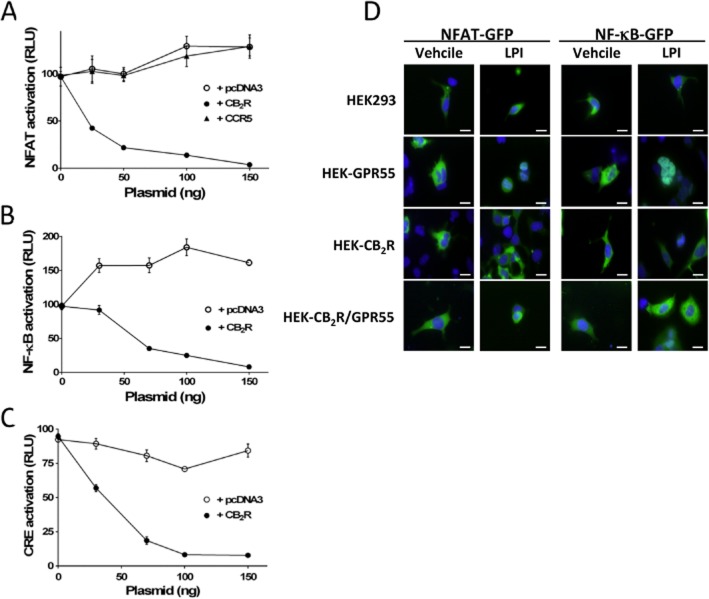
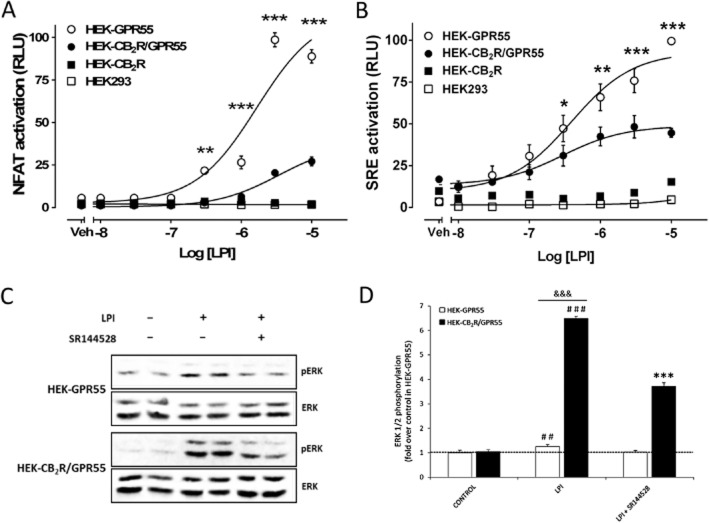
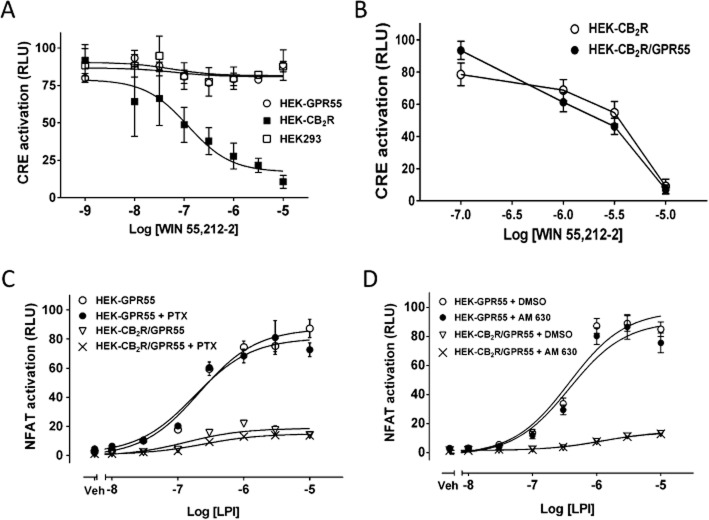
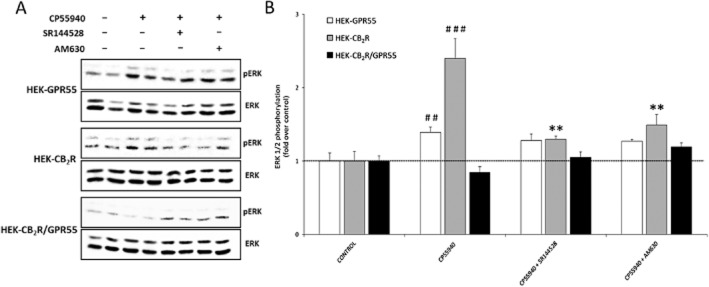
Key results: GPR55 and CB2 receptors co-localized on the surface of HEK293 cells, co-precipitated in membrane extracts and formed heteromers in living HEK293 cells. Whereas heteromerization led to a reduction in GPR55-mediated activation of transcription factors (nuclear factor of activated T-cells, NF-κB and cAMP response element), ERK1/2-MAPK activation was potentiated in the presence of CB2 receptors. CB2 receptor-mediated signalling was also affected by co-expression with GPR55. Label-free assays confirmed cross-talk between the two receptors.

Conclusions and implications: Heteromers, unique signalling units, form in HEK293 cells expressing GPR55 and CB2 receptors. The signalling by agonists of either receptor was governed (i) by the presence or absence of the partner receptors (with the consequent formation of heteromers) and (ii) by the activation state of the partner receptor.


Figures

Figure 1
Figure 1
GPR55 and CB2 receptors co-localize on the surface of HEK293 cells and form heteromers. (A) HEK293 cells stably expressing HA-tagged GPR55 (HEK-GPR55), FLAG-tagged CB2 receptor (HEK-CB2R), both receptors (HEK-CB2R/GPR55) or none (HEK293) were fed with anti-HA and anti-FLAG antibodies for 30 min, followed by staining with Alexa Fluor 594-conjugated goat anti-mouse IgG1a (red) and Alexa Fluor 488-conjugated goat anti-mouse IgG2b (green) antibodies and nuclei were counterstained with DAPI. Images were captured and analysed with Zeiss LSM510 META Axioplan confocal microscope and are representative of 2–3 experiments. Original magnification: 40×. Scale bar: 20 μm. (B) Cells were stained with anti-FLAG and/or anti-HA antibody and appropriate secondary antibodies in FACS tubes, fixed and measured in a FACSCalibur flow cytometer (Becton Dickinson, CA, USA). Mean fluorescence intensity (MFI) of GPR55 staining in HEK-GPR55 cells and CB2 receptors in HEK-CB2R cells were considered as 100%, respectively, and were used to normalize receptor expression in double-expressing cells. Data are mean ± SEM from two independent experiments performed in duplicate. (C) Lysates from stable cells lines were centrifuged and parts of the supernatants were kept at −20°C for FLAG, HA and β-actin control blots while the rest of the supernatant was subjected to Co-IP. After SDS-PAGE and transferring to PVDF membranes HA-GPR55, FLAG-CB2R and β-actin were detected using anti-HA, anti-FLAG or anti-β-actin antibody respectively. Representative blots from five independent experiments are shown. (D) Analysis of Co-IP results was conducted by densitometry of protein bands in blots using ImageJ. Data are mean ± SEM from four independent experiments. (E) BRET saturation experiments showing CB2R-GPR55 heteromerization were performed using cells transfected with 0.5 μg of cDNA corresponding to GPR55-Rluc and increasing amounts of cDNA (0–3 μg cDNA) corresponding to CB2R-YFP. As negative control, cells were also transfected with cDNA corresponding to GPR55-Rluc (0.5 μg) and dopamine D4.2R-YFP (0 to 4 μg cDNA). Both fluorescence and luminescence for each sample were measured before each experiment to confirm similar donor expressions (approximately 150 000 bioluminescence units) while monitoring the increase in acceptor expression (100 to 80 000 net fluorescence units). The relative amount of BRET is given as the ratio between the fluorescence of the acceptor minus the fluorescence detected in cells expressing only the donor and the luciferase activity of the donor. BRET data are expressed as the mean ± SEM of 4–8 different experiments; data are grouped according to the signal provided by the BRET acceptor. mBU, mili BRET units. (F) HEK293 cells transiently co-transfected with GPR55-Rluc and CB2R-YFP were fixed and incubated with polyclonal anti-GPR55 antibody followed by staining with Alexa Fluor 546-conjugated goat anti-rabbit IgG antibody, for GPR55-Rluc receptor visualization (red channel). Cell nuclei were stained with TO-PRO-3 (blue channel). Cells were inspected under LSM 510 META (Zeiss, Jena, Germany) inverted confocal microscope equipped with a 40xP-Neofluar (NA 1.3). CB2R-YFP was visualized directly following excitation with the argon laser at 488 nm (green channel). Images were acquired using the Zeiss software (Aim4) and are representative of 2–3 experiments. Original magnification: 40×. Scale bar: 7 μm.
Figure 2
Figure 2
LPI-induced co-internalization of CB2 receptors and GPR55. HEK293 cell lines were fed with anti-HA and anti-FLAG antibodies for 30 min followed by stimulation with 2.5 μM LPI for 45 min. Fixed cells were then stained with Alexa Fluor 594-conjugated goat anti-mouse IgG1a (red) and Alexa Fluor 488-conjugated goat anti-mouse IgG2b (green) antibodies and their nuclei were counterstained with DAPI. Images were captured and analysed with Zeiss LSM510 META Axioplan confocal microscope and are representative of 2–3 experiments. Original magnification: 40×. Scale bar: 20 μm.
Figure 3
Figure 3
The CB2 receptor reduces the GPR55-mediated activation of transcription factors. HEK-GPR55 cells seeded in 96-well plates were transiently transfected with increasing amounts of pcDNA3, pcDNA-CB2R or pcDNA-CCR5 plasmids along with constant amounts of (A) pNFAT-Luc (B) pNF-κB-Luc or (C) pCRE-Luc plasmids for 48 h. Cells were then stimulated with 1 μM LPI for 6 h in a serum-free medium. Luciferase activity was visualized using Steadylite plus kit (PerkinElmer). Luminescence expressed as relative light units (RLU) was measured in a TopCounter (Top Count NXT; Packard) for 5 s. Data are mean ± SEM of a representative experiment out of 2–3 independent experiments performed in quadruplicate. (D) Cells were transiently transfected with GFP-tagged NFATc3 or EGFP-tagged p65 subunit of NF-κB and after serum starvation cells were stimulated with either vehicle or 5 μM LPI for 30 min. Translocation of GFP-tagged transcription factors was visualized using an Olympus fluorescence microscope equipped with a Hamamatsu ORCA CCD camera. Cell nuclei were stained with DAPI (blue). Representative cells of four independent experiments are shown. Original magnification: 60×. Scale bars: 20 μm.
Figure 4
Figure 4
Effect of stable expression of CB2 receptors on GPR55-mediated activation of transcription factors and ERK1/2-MAP kinase. Stable cell lines seeded in 96-well plates were transfected with (A) pNFAT-Luc or (B) pSRE-Luc. Twenty four hours post-transfection, cells were stimulated with increasing concentrations of LPI in serum-free media for 6 h. Luciferase activity was measured as in Figure 3. Data are mean ± SEM of a representative experiment out of 3–5 independent experiments performed in quadruplicate. Statistical analysis was performed to compare SRE responses in HEK-GPR55 versus HEK-CB2R/GPR55 cells by two-way anova followed by Bonferroni's post hoc multiple comparison test. *P < 0.05; **P < 0.01; ***P < 0.001. (C) HEK-GPR55 and HEK-CB2R/GPR55 cells were seeded on six-well plates and 24 h post-serum starvation cells were stimulated with 2.5 μM LPI for 10 min or pretreated for 10 min with the CB2 receptor antagonist SR144528 (250 nM) before agonist treatment. Total ERK1/2 and phosphorylated ERK1/2 in cell lysates were analysed by Western blotting. One representative blot from three independent experiments is shown. (D) Phosphorylated ERK1/2 and ERK1/2 bands in the blots from panel C were analysed by Image Studio software 1.1 (LI-COR Biosciences). Data were normalized to the basal ratio of pERK1/2 to ERK1/2 in HEK-GPR55 cells and are mean ± SEM from three independent experiments. Significant differences were determined by one-way anova followed by post hoc Tukey's t-test (##P < 0.01, ###P < 0.001 compared with control; ***P < 0.001 compared with HEK-CB2R/GPR55 cells treated with LPI) or a Student's t-test (&&&P < 0.001 HEK-GPR55 cells compared with HEK-CB2R/GPR55).
Figure 5
Figure 5
Gi signalling downstream of CB2 receptors is not involved in the receptor cross-talk that affects transcription factors. (A) Stable cell lines seeded in a 96-well plate were transfected with pCRE-Luc. Twenty four hours post-transfection, cells were pre-incubated with 1 mM IBMX for 10 min in serum-free media. Cells were then treated with increasing concentrations of WIN 55, 212-2 for 30 min followed by stimulation with 5 μM forskolin for 10 min. Luciferase activity was measured as in Figure 3. (B) CRE activation was measured in HEK-CB2 receptor and HEK-CB2R/GPR55 cells in response to several concentrations of WIN 55, 212-2, as described in panel A. (C) HEK-GPR55 and HEK-CB2R/GPR55 cells seeded in 96-well plates were transfected with pNFAT-Luc. Twenty four hours post-transfection, cells were pre-incubated with 100 ng·mL−1 PTX overnight. Thereafter, cells were stimulated with increasing concentrations of LPI in serum-free media containing 25 ng·mL−1 PTX for 6 h. (D) HEK-GPR55 and HEK-CB2R/GPR55 cells were seeded as in panel C and were then pre-incubated with either 5 μM AM 630 or the vehicle (DMSO) for 30 min. Cells were then stimulated with increasing concentrations of LPI as in panel C. Luciferase activity was measured as in Figure 3. Data are mean ± SEM from a representative experiment from three independent experiments performed in quadruplicate.
Figure 6
Figure 6
Effect of stable expression of GPR55 on CB2 receptor-mediated activation of ERK1/2-MAP kinase. (A) HEK-GPR55, HEK-CB2 receptor and HEK-CB2R/GPR55 cells were seeded on six-well plates and 24 h post-serum starvation, cells were stimulated with CP 55,940 (100 nM) for 10 min or pretreated for 10 min with CB2 receptor antagonists SR144528 (250 nM) and AM 630 (250 nM) before agonist treatment. Total ERK1/2 and phosphorylated ERK1/2 in cell lysates were analysed by Western blotting with respective antibodies. One representative blot from three independent experiments is shown. (B) Phosphorylated ERK1/2 and ERK1/2 bands in the blots from panel A were analysed by using the Image Studio software 1.1 (LI-COR Biosciences). Data were normalized to the basal ratio of pERK1/2 to ERK1/2 and are mean ± SEM from three independent experiments. Significant differences were analysed by one-way anova followed by post hoc Tukey's t-test (##P < 0.01, ###P < 0.001 compared with control; **P < 0.01 compared with cells treated with CP 55,940).
Figure 7
Figure 7
Assessment of cross-talk between GPR55 and CB2R by DMR label-free technology. All stable cell lines were stimulated with increasing concentrations of LPI and the resulting picometer shifts (pm) of reflected light wavelength against time (s) were monitored and are shown for (A) HEK-GPR55 cells and (B) HEK-CB2R/GPR55 cells. (C) Transformation of optical signatures was made by using the AUC values between the 0 and 3600 s time points. Data were normalized and expressed as % of maximum activation induced by LPI in HEK-GPR55 cells. Data are the mean ± SEM of at least three independent experiments each performed in triplicate. Statistical analysis was performed for LPI-mediated responses in HEK-GPR55 versus HEK-CB2R/GPR55 cells by two-way anova followed by Bonferroni's post hoc multiple comparison test. **P < 0.01; ***P < 0.001. (D) HEK-GPR55 and HEK-CB2R/GPR55 cells were seeded as in panel A–C and were then pre-incubated with either 1 μM AM 630 or the vehicle (DMSO) for 1 h. Cells were then stimulated with increasing concentrations of LPI as in panel A–C. Data are analysed as in panel C and are the mean ± SEM of three independent experiments each performed in triplicate. Dashed curves represent data that are taken from Figure 7C and are depicted again to facilitate comparison.
Figure 8
Figure 8
Assessment of CB2 receptor function in the absence and presence of GPR55 using label-free DMR technology. All stable cell lines were stimulated with 1 μM of the mixed CB1/CB2 receptor agonist, 2-AG, or DMSO as vehicle and the resulting picometer shifts of reflected light wavelength were monitored over time as in Figure 7. Shown are mean values ± SEM of one out of four independent experiments each performed in triplicate.
Figure 9
Figure 9
Assessment of cross-talk between GPR55 and CB2 receptors by impedance determinations. CellKey label-free assays were performed in HEK-GPR55 and HEK-CB2R/GPR55 cells, treated with 1 nM of A-836339 (CB2 receptor agonist), 5 μM of LPI or both. Results correspond to the maximal decrease in impedance with respect to basal levels. Representative traces for individual assays are shown for (A) HEK-GPR55 and (B) HEK-CB2R/GPR55 cells (traces corresponding to 2 s interval recordings of impedance in four different wells). (C) The maximum decay in impedance that is, for each well, automatically provided by the equipment is depicted as bar graph (data for HEK-CB2 receptor also shown). Data are mean ± SEM from 4–8 independent experiments performed in quadruplicates. Statistical significance was calculated by one-way anova followed by Bonferroni's post hoc multiple comparison test (#P < 0.05 with respect to A-836339; *P < 0.05 with respect to LPI).
Figure 10
Figure 10
Scheme of signalling modulation in the CB2 receptor-GPR55 heteromer. (A) Modification of LPI-induced signalling in the heteromer and inhibition of LPI-induced ERK1/2 activation by CB2 receptor antagonists (cross-antagonism). (B) Modification of CB2 receptor agonist-induced signalling in the heteromer; although co-expression of GPR55 does not modulate the Gi-mediated CB2 receptor signalling to oppose cAMP production, it suppresses the CB2 receptor-initiated ERK1/2 activation. (C) Summary of label-free responses (DMR and impedance: dZiec) upon activation by cannabinoid agonists and/or LPI.

References

    1. Alexander SP, Benson HE, Faccenda E, Pawson AJ, Sharman JL, Spedding M, et al. The Concise Guide to PHARMACOLOGY 2013/14: G protein-coupled receptors. Br J Pharmacol. 2013a;170:1459–1581. - PMC - PubMed
    1. Alexander SP, Benson HE, Faccenda E, Pawson AJ, Sharman JL, Spedding M, et al. The Concise Guide to PHARMACOLOGY 2013/14: Enzymes. Br J Pharmacol. 2013b;170:1797–1867. - PMC - PubMed
    1. Andradas C, Caffarel MM, Perez-Gomez E, Salazar M, Lorente M, Velasco G, et al. The orphan G protein-coupled receptor GPR55 promotes cancer cell proliferation via ERK. Oncogene. 2011;30:245–252. - PubMed
    1. Atwood BK, Straiker A, Mackie K. CB(2): therapeutic target-in-waiting. Prog Neuropsychopharmacol Biol Psychiatry. 2012;38:16–20. - PMC - PubMed
    1. Balenga NA, Aflaki E, Kargl J, Platzer W, Schroder R, Blattermann S, et al. GPR55 regulates cannabinoid 2 receptor-mediated responses in human neutrophils. Cell Res. 2011a;21:1452–1469. - PMC - PubMed

Publication types

MeSH terms