Growth, Feed Utilization and Blood Metabolic Responses to Different Amylose-amylopectin Ratio Fed Diets in Tilapia (Oreochromis niloticus)
- PMID: 25049897
- PMCID: PMC4093233
- DOI: 10.5713/ajas.2013.13022
Growth, Feed Utilization and Blood Metabolic Responses to Different Amylose-amylopectin Ratio Fed Diets in Tilapia (Oreochromis niloticus)
Abstract
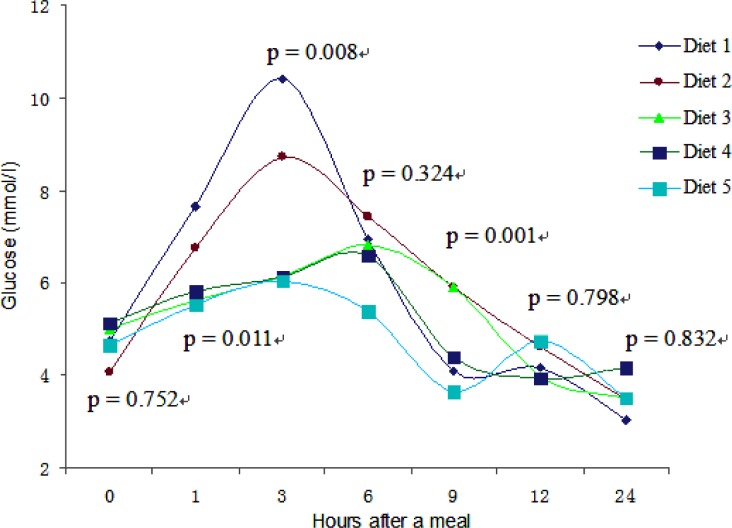
A feeding trial was conducted in tilapia to determine the growth performance, nutrient digestibility, digestive enzymes, and postprandial blood metabolites in response to different dietary amylose-amylopectin ratios. Five isonitrogenous and isolipidic diets containing an equal starch level with different amylose-amylopectin ratios of 0.11 (diet 1), 0.24 (diet 2), 0.47 (diet 3), 0.76 (diet 4) and 0.98 (diet 5) were formulated using high-amylose corn starch (as the amylose source) and waxy rice (as the amylopectin source). Each diet was hand-fed to six tanks of 15 fish each, three times a day over a 6-wk period. After the growth trial, a postprandial blood metabolic test was carried out. Fish fed diet 2 exhibited the highest percent weight gain and feed efficiency and protein efficiency ratio, whereas fish fed with diet 5 showed the lowest growth and feed utilization among treatments. The digestibility for starch in fish fed diet 1 and 2 was higher than those in fish fed with other diets (p<0.05). The highest activities for protease, lipase and amylase were found in fish fed the diet 2, diet 1, and diet 1 respectively among dietary treatments, while the lowest values for these indexes were observed in fish fed the diet 3, diet 5 and diet 4, respectively. The liver glycogen concentrations in fish fed diets 4 and 5 were found higher than in fish fed other diets (p<0.05). The feeding rate, hepatosomatic index, condition factor, and plasma parmeters (glucose, triglyceride, total cholesterol, high-density lipoprotein cholesterol, and low-density lipoprotein cholesterol) did not differ across treatments. In terms of postprandial blood responses, peak blood glucose and triglycerides were lower after 3 or 6 h in the fish fed with diets 3-5 than in the fish fed diet 1, but delayed peak blood total amino acid time was observed in fish fed with the diets 1 or 2. The lowest peak values for each of the three blood metabolites were observed in fish fed diet 5. The results indicate that high-dietary amylose-amylopectin ratio could compromise growth, but help in reducing the blood glucose stress on fish caused by postprandial starch load.
Keywords: Amylopectin; Amylose; Performance; Postprandial Response; Tilapia.
Figures


References
-
- AOAC . Association of Official Analytical Chemists. In: Cunniff PA, editor. Official Methods of Analysis. 16th edn. AOAC International; Arlington, VA, USA: 1995.
-
- Aziz AA, Kenney LS, Goulet B, Abdel-Aal E. Dietary starch type affects body weight and glycemic control in freely fed but not energy-restricted obese rats. J Nutr. 2009;139:1881–1889. - PubMed
-
- Behall KM, Hallfrisch J. Plasma glucose and insulin reduction after consumption of breads varying in amylose content. Eur J Clin Nutr. 2002;56:913–920. - PubMed
-
- Behall KM, Scholfield DJ, Canary J. Effect of starch structure on glucose and insulin responses in adults. Am J Clin Nutr. 1988;47:428–432. - PubMed
-
- Behall KM, Scholfield DJ, Yuhaniak I, Canary J. Diets containing high amylose vs amylopectin starch: effects on metabolic variables in human subjects. Am J Clin Nutr. 1989;49:337–344. - PubMed
LinkOut - more resources
Full Text Sources
Other Literature Sources