

Age-related different relationships between ectopic adipose tissues and measures of central obesity in sedentary subjects
- PMID: 25051047
- PMCID: PMC4106895
- DOI: 10.1371/journal.pone.0103381
Age-related different relationships between ectopic adipose tissues and measures of central obesity in sedentary subjects
Abstract
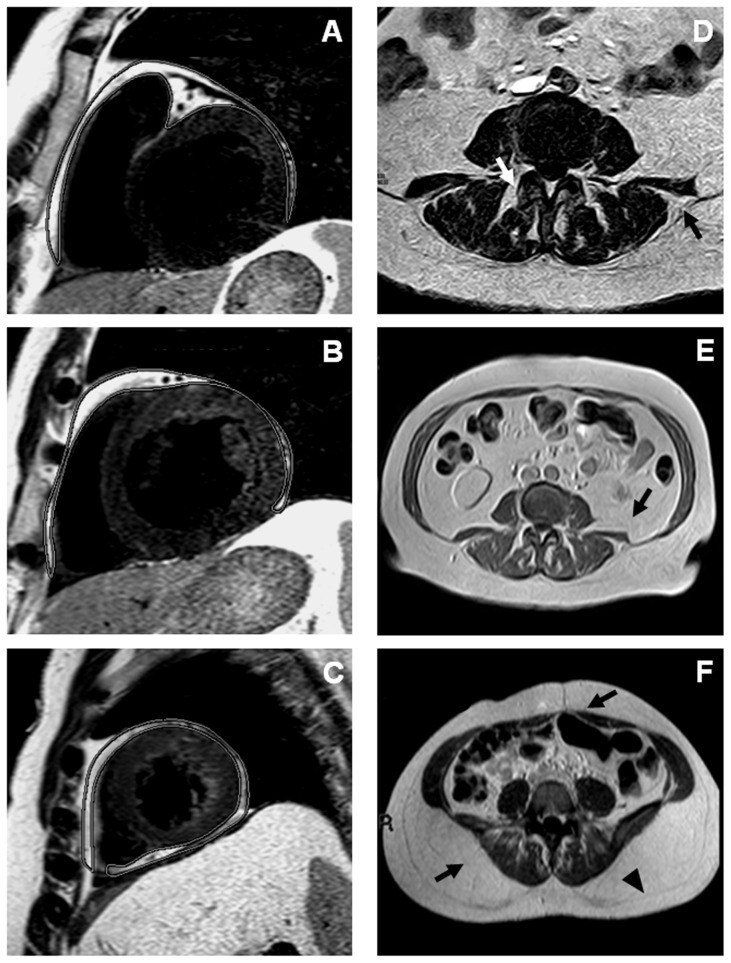
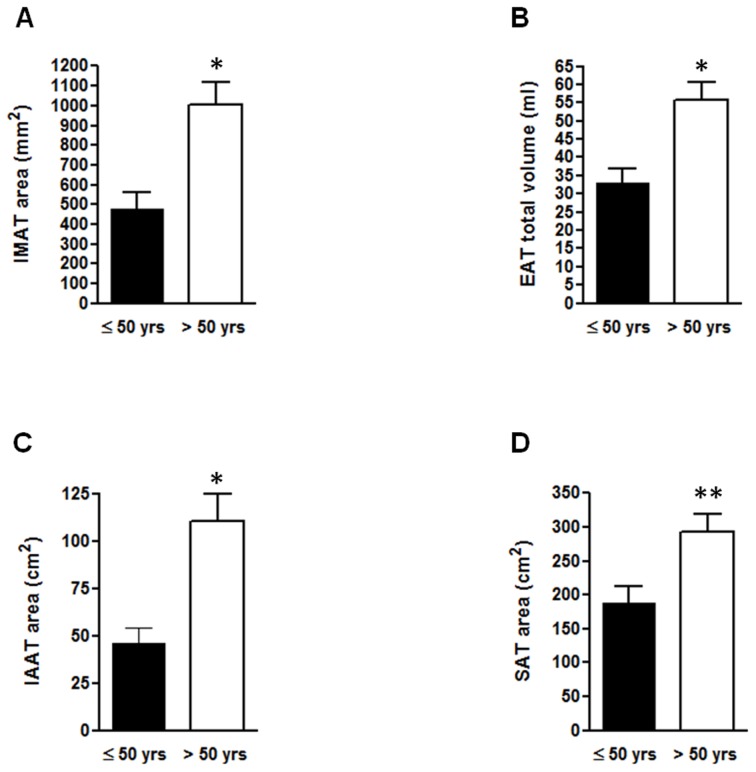
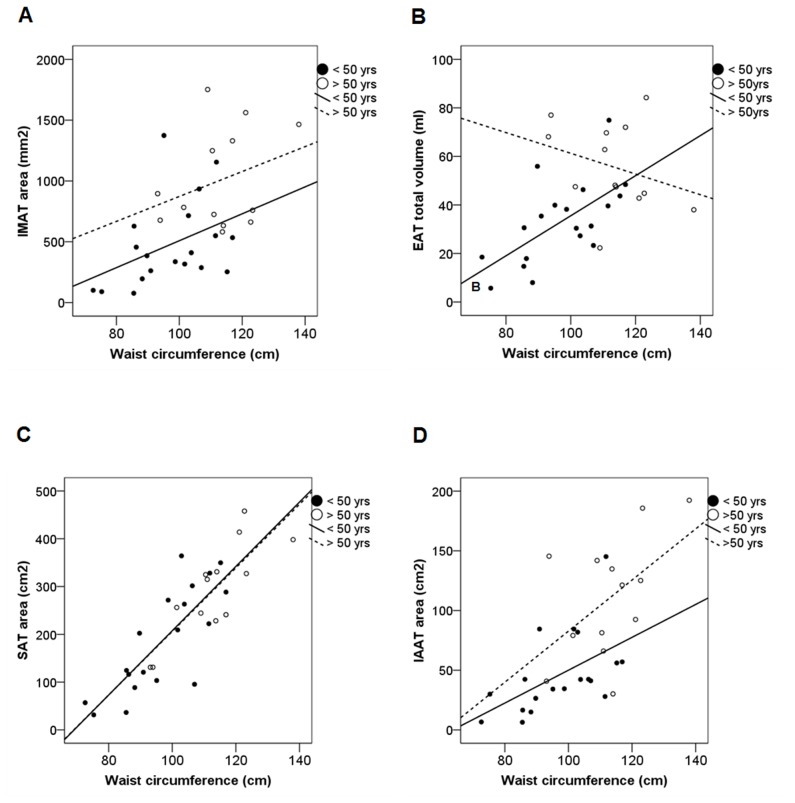
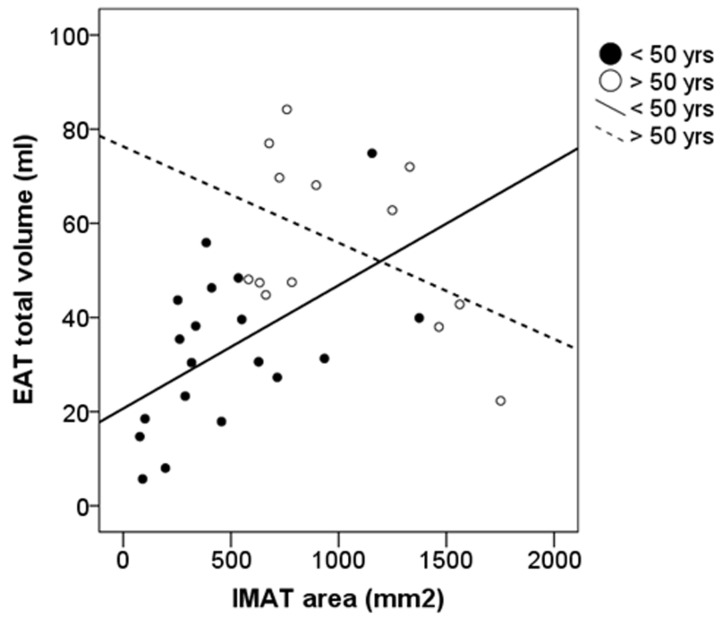
Accumulation of fat at ectopic sites has been gaining attention as pivotal contributor of insulin resistance, metabolic syndrome and related cardiovascular complications. Intermuscular adipose tissue (IMAT), located between skeletal muscle bundles and beneath muscle fascia, has been linked to physical inactivity, ageing and body mass index, but little is known about its relationship with the other AT compartments, in particular with increasing age. To address this issue, erector spinae IMAT, epicardial (EAT), intraabdominal (IAAT) and abdominal subcutaneous adipose tissue (SAT) were simultaneously measured by Magnetic Resonance Imaging (MRI) and related to waist circumference measurements and age in 32 sedentary subjects without cardiovascular disease (18 men; 14 women; mean age 48.5 ± 14 years). Fasting glucose, triglycerides and HDL-cholesterol were also assessed. We observed that, after dividing individuals according to age (≤ or > 50 years), IMAT and EAT depots were significantly more expanded in older subjects (63.2 ± 8.3 years) than in the younger ones (38.4 ± 5.2 years) (p < 0.001). Overall, both IMAT and EAT showed stronger positive associations with increasing age (β = 0.63 and 0.67, respectively, p < 0.001 for both) than with waist circumference (β = 0.55 and 0.49, respectively, p < 0.01 for both) after adjusting for gender. In addition, the gender-adjusted associations of IMAT and EAT with waist circumference and IAAT were significant in individuals ≤ 50 years only (p<0.05 for all) and not in the older ones. In contrast, no age-related differences were seen in the relationships of IAAT and SAT with waist circumference. Finally, serum triglycerides levels turned out not to be independently related with ectopic IMAT and EAT. In conclusion, the expansion of IMAT and EAT in sedentary subjects is more strongly related to age than waist circumference, and a positive association of these ectopic depots with waist circumference and IAAT amount can be postulated in younger individuals only.
Conflict of interest statement
Figures
References
-
- Fox CS, Massaro JM, Hoffmann U, Pou KM, Maurovich-Horvat P, et al. (2007) Abdominal visceral and subcutaneous adipose tissue compartments: association with metabolic risk factors in the Framingham Heart Study. Circulation 116: 39–48. - PubMed
-
- Tchernof A, Despres JP (2013) Pathophysiology of human visceral obesity: an update. Physiol Rev 93: 359–404. - PubMed
-
- Thamer C, Machann J, Haap M, Stefan N, Heller E, et al. (2004) Intrahepatic lipids are predicted by visceral adipose tissue mass in healthy subjects. Diabetes Care 27: 2726–2729. - PubMed
Publication types
MeSH terms
Substances
LinkOut - more resources
Full Text Sources
Other Literature Sources
Research Materials
