. 2014 Jul 22;12(7):e1001912.
doi: 10.1371/journal.pbio.1001912. eCollection 2014 Jul.

Schlemm's canal is a unique vessel with a combination of blood vascular and lymphatic phenotypes that forms by a novel developmental process

Affiliations

Schlemm's canal is a unique vessel with a combination of blood vascular and lymphatic phenotypes that forms by a novel developmental process

Krishnakumar Kizhatil et al. PLoS Biol. .

Abstract

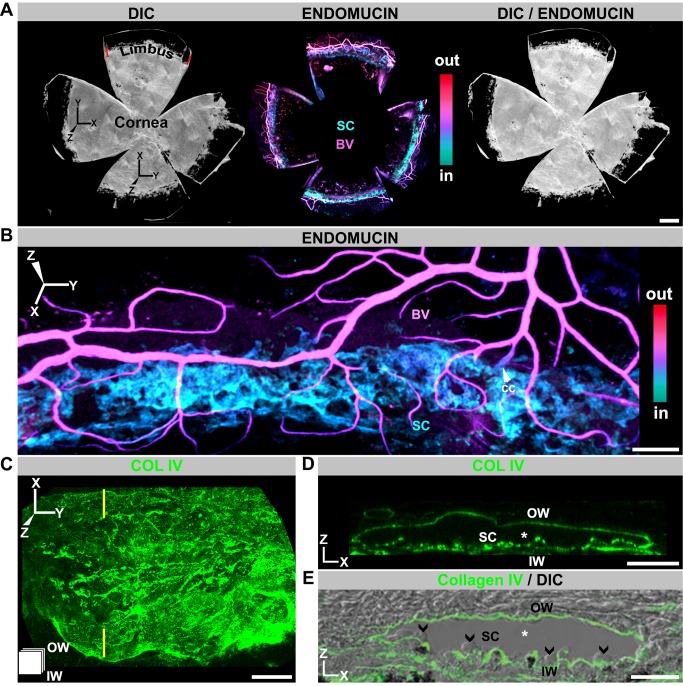
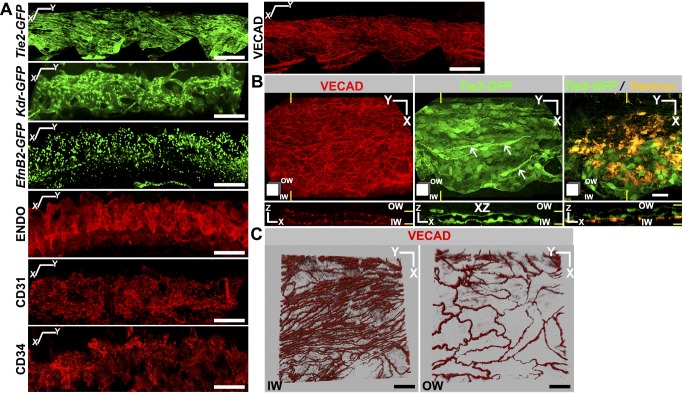
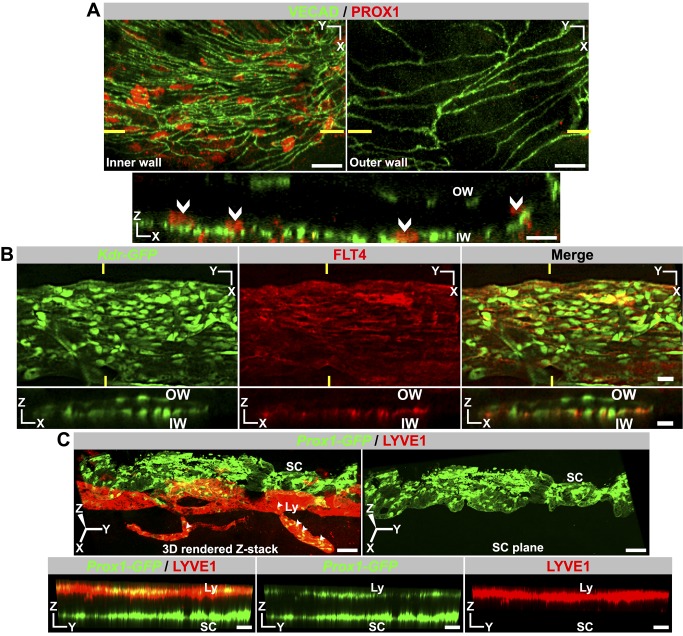
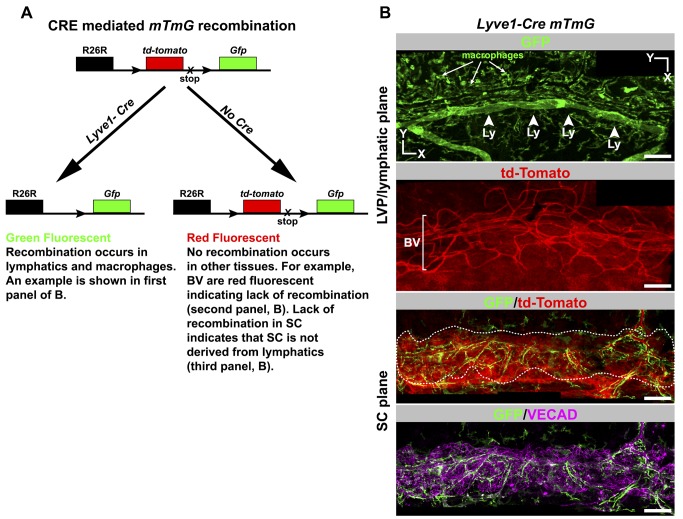
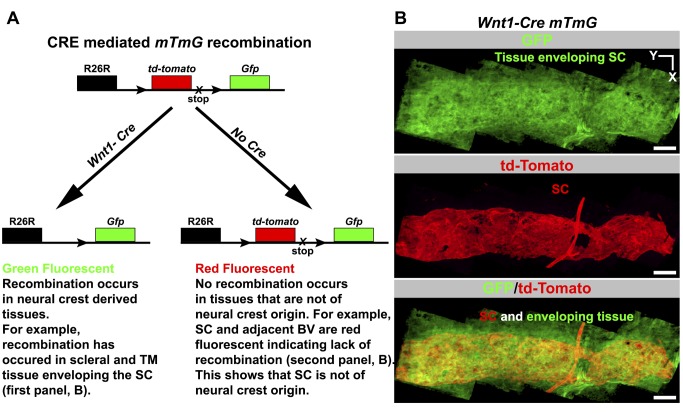
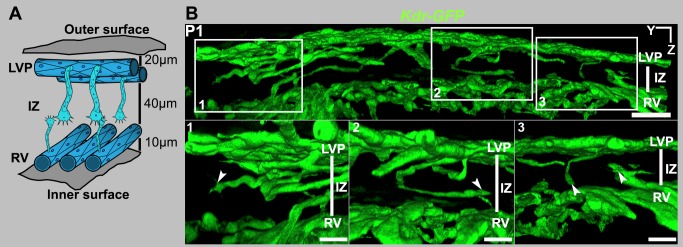
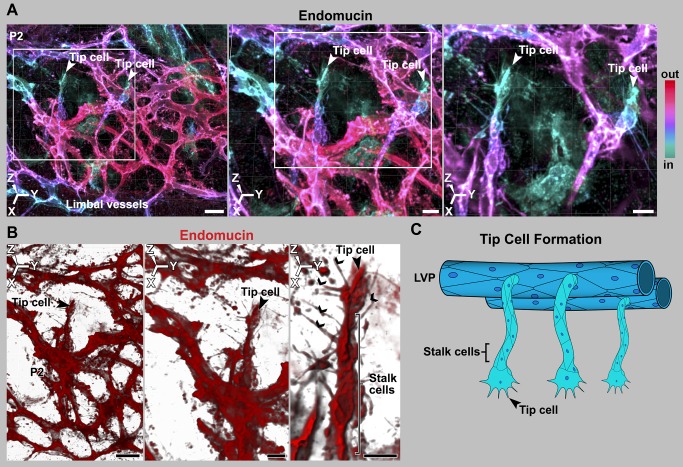
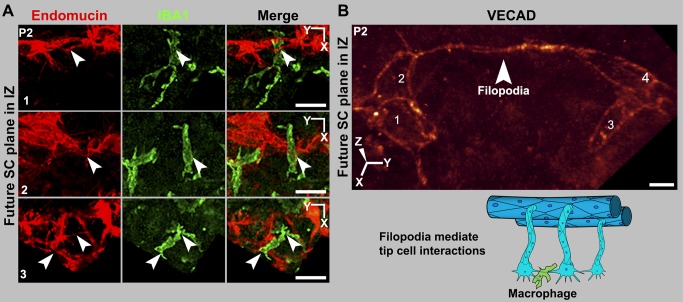
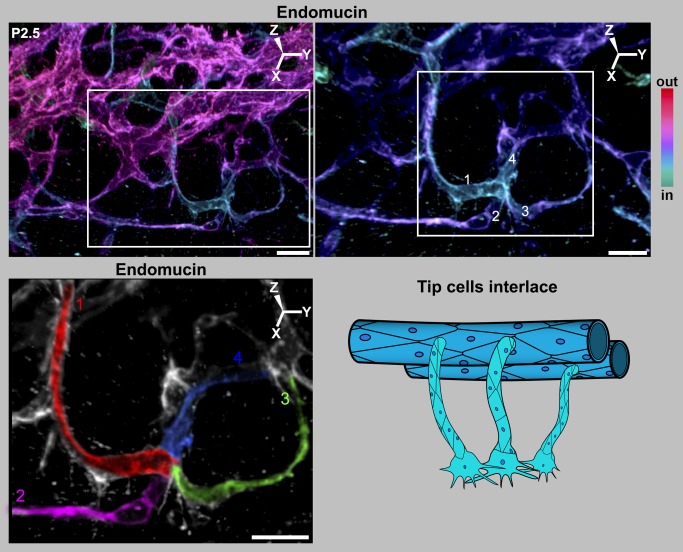
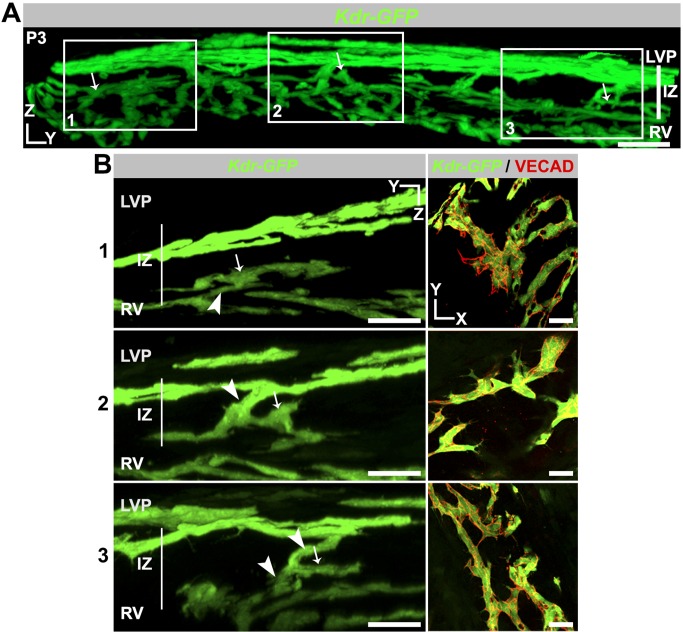
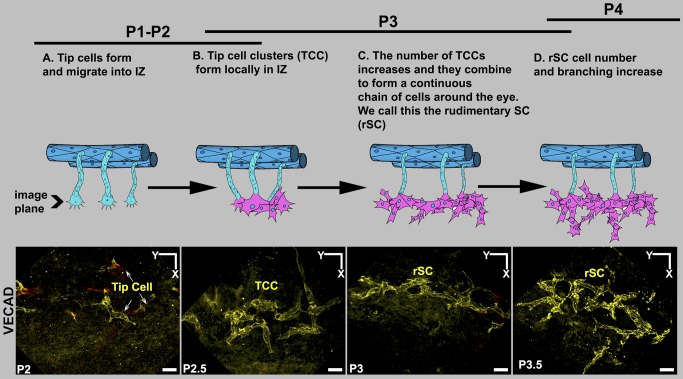
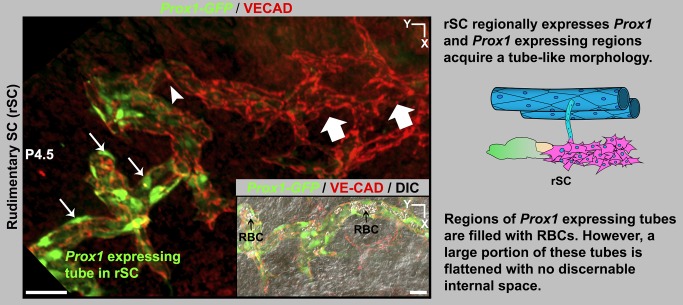
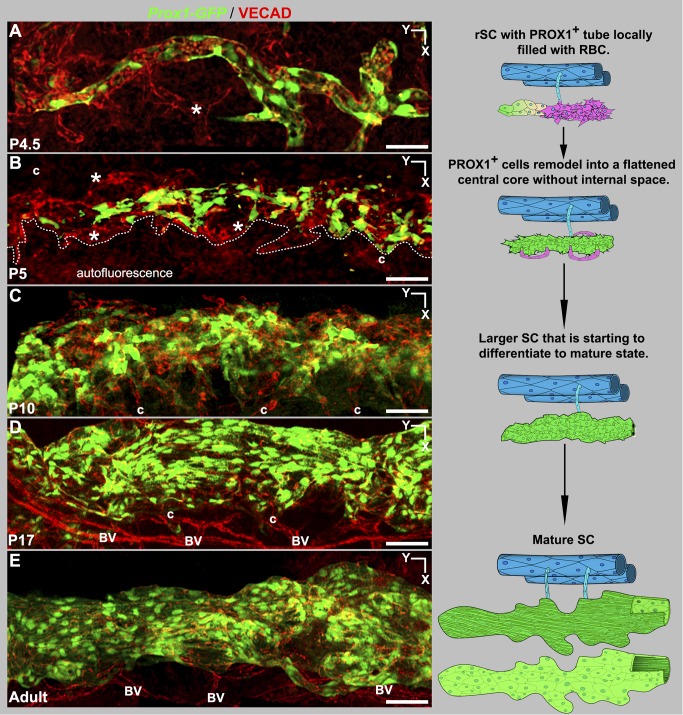
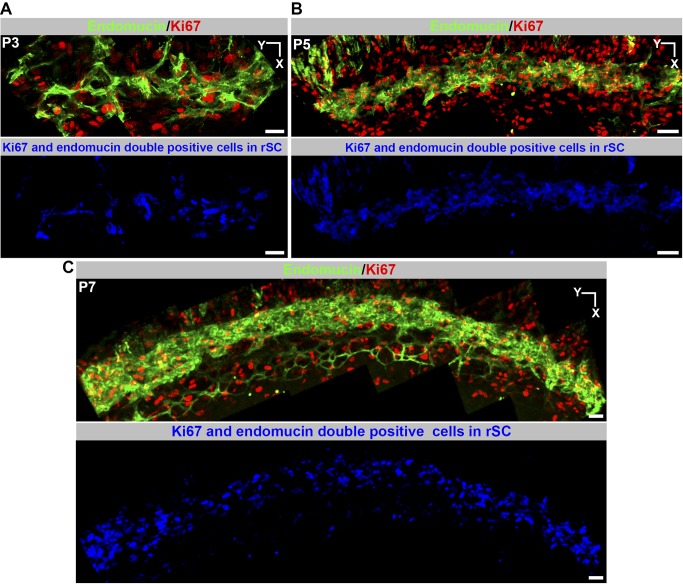
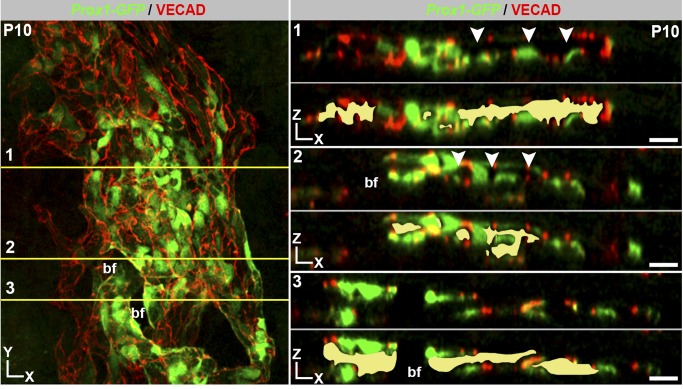
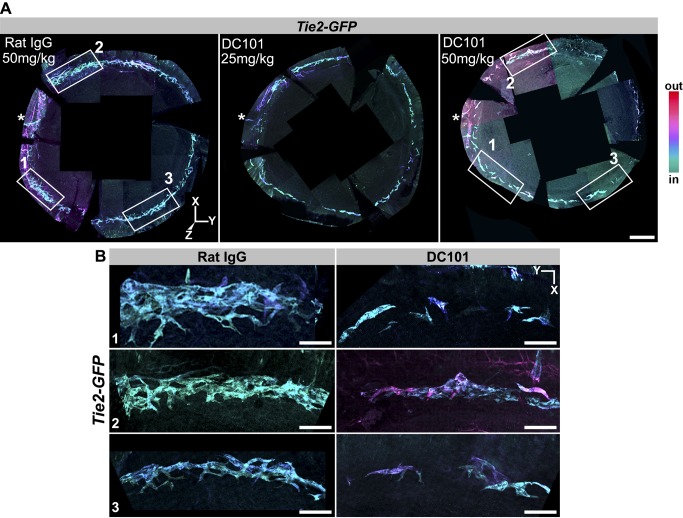
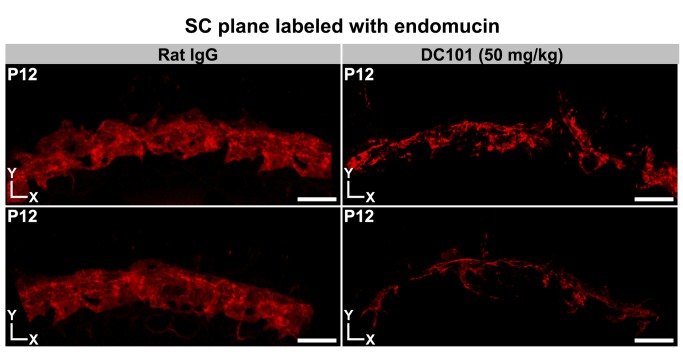
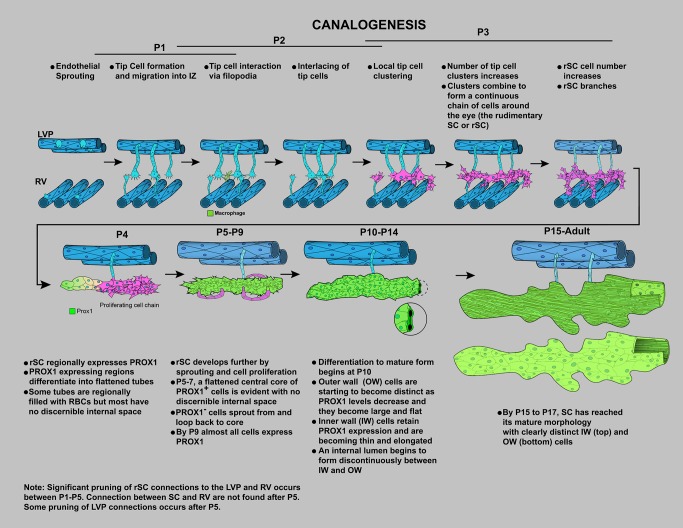
Schlemm's canal (SC) plays central roles in ocular physiology. These roles depend on the molecular phenotypes of SC endothelial cells (SECs). Both the specific phenotype of SECs and development of SC remain poorly defined. To allow a modern and extensive analysis of SC and its origins, we developed a new whole-mount procedure to visualize its development in the context of surrounding tissues. We then applied genetic lineage tracing, specific-fluorescent reporter genes, immunofluorescence, high-resolution confocal microscopy, and three-dimensional (3D) rendering to study SC. Using these techniques, we show that SECs have a unique phenotype that is a blend of both blood and lymphatic endothelial cell phenotypes. By analyzing whole mounts of postnatal mouse eyes progressively to adulthood, we show that SC develops from blood vessels through a newly discovered process that we name "canalogenesis." Functional inhibition of KDR (VEGFR2), a critical receptor in initiating angiogenesis, shows that this receptor is required during canalogenesis. Unlike angiogenesis and similar to stages of vasculogenesis, during canalogenesis tip cells divide and form branched chains prior to vessel formation. Differing from both angiogenesis and vasculogenesis, during canalogenesis SECs express Prox1, a master regulator of lymphangiogenesis and lymphatic phenotypes. Thus, SC development resembles a blend of vascular developmental programs. These advances define SC as a unique vessel with a combination of blood vascular and lymphatic phenotypes. They are important for dissecting its functions that are essential for ocular health and normal vision.


Conflict of interest statement

The authors have declared that no competing interests exist.

Figures

Figure 1
Figure 1. SC visualized in 3D using whole mounts.
(A) Enface view of adult SC and other limbal vessels. (Left) DIC image of a whole mount prepared as in Figure S1. SC and limbal vessels are located in the limbus, just inside the dark pigmented band (see Figure S1). (Middle) Localization of the limbal vessels stained with endomucin in a Z-projection of confocal limbal stacks encompassing the entire whole mount. The whole-mount stacks were Z-depth color-coded (ICE LUT, see Figure S1). Color scale shows depth code colors of all structures stained with endomucin from inside (in) the eye to outside (out), with the SC being the most internal coded structure. (Right) Overlay of DIC and immunofluorescence image. (B) Higher magnification showing SC in relation to blood vessels of the LVP. BV, blood vessel; cc, collector channel. The blood vessels (magenta) are closer to the external ocular surface than SC (cyan). (C, D) Imaged whole mounts with the basement membrane marker collagen IV (COLIV) used to highlight SC in enface (XY) and conventional (XZ) orientations. (C) XY view; the icon in the lower left corner indicates the orientation of SC (also used in subsequent figures). The inner wall (IW) is closer to the reader, and the outer wall (OW) is away from the reader. (D) XZ view through the plane indicated by yellow lines in (C). In this XZ orientation, the lumen of SC (*) is evident between the COLIV-labeled inner and outer walls (compare to E). (E) Frozen section with COLIV labeling overlaid on its DIC image. The similarity between the XZ-represented whole mount and frozen section is clear. Note the characteristic bulbous undulations of the inner wall protruding into the lumen (arrowheads). Scale bar, (A) 500 µm, (B) 100 µm, and (C–E) 20 µm.
Figure 2
Figure 2. Adult SC expresses a panel of vascular markers.
(A) Marker expression as determined by GFP expression (green, transgenic mice; see Methods) or immunostaining (red). Z-projections of limbal confocal planes encompassing SC. X and Y coordinate markers are slightly offset to indicate the curvature of SC. (B and C) Morphologically distinct cells comprise inner (IW) and outer walls (OW) of SC. (B) Tie2-GFP+ SC immunostained with VECAD. Yellow lines indicate the locations of the XZ planes in bottom panels. Although Tie2-GFP continuously marks both walls, the cell junction marker VECAD is densely packed in IW but more widely spaced in the OW (bottom panels in B). This is consistent with IW cells being long (along Y axis) and thin (X axis) and OW cells being shorter and wider. The long thin nature of IW cells is clearly evident in the Tie2-GFP XY image (arrows). Confirming the identity of SC and its walls, fluorescent dextran that was perfused into the anterior chamber (yellow) accumulated at the IW (right panels). (C) Higher magnification images specifically showing IW and OW confirm this morphology. Z stacks encompassing either the IW SCE (Left) or OW SCE (Right) immunostained with VECAD were Z-projected in blend mode of Imaris to provide depth perception. Scale bar, (A) 100 µm and (B–C) 20 µm.
Figure 3
Figure 3. Adult SC produces the lymphatic markers PROX1 and FLT4 but not LYVE1.
(A–B) Immunolabeling detects PROX1 protein and FLT4 in the inner wall (IW) SCE but not outer wall (OW) SCE. Nuclear localization of PROX1 is demonstrated in Figure S3. In both (A) and (B), high-magnification Z stacks that encompass either the IW or the OW were Z-projected to produce XY images (Top panel). XZ section (Bottom panel) through the plane indicated by yellow lines (Top panels) confirms expression of PROX1 is restricted to IW cell nuclei and FLT4 largely to the IW SCE. (C) LYVE1 protein is absent in SC. In the limbus, the lymphatics (Ly) run closer to the outer ocular surface than SC. In an enface 3D view from the outer surface perspective of a Prox1-GFP eye, the lymphatics run on top of the SC. (Left) 3D rendering has been rotated towards the viewer so that the lymphatics do not obscure the SC. The yellow represents the co-labeling of lymphatics with both LYVE1 and Prox1-GFP (arrowheads). (Right) The lymphatic in the left image has been removed, clearly showing that SC produces no detectable LYVE1. Bottom panels are the same YZ plane through the 3D rendering in the left top panel. Also see Figure S4. Scale bar, (A–C) 20 µm.
Figure 4
Figure 4. Lineage tracing using a Lyve1-Cre mouse shows SC does not originate from lymphatics.
(A) Outcome of a genetic cross between a Lyve1-Cre mouse and the Cre reporter ROSA26R-mtmG (mTmG) mouse. Cre expressed from the Lyve1 promoter is found early in developing lymphatic tissue and in macrophages. CRE-mediated recombination indelibly labels lymphatics and macrophages with GFP fluorescence in a backdrop of red fluorescent cells that are not of these lineages. Because this recombination is irreversible, tissue derived from Lyve1-expressing cells will always be green fluorescent. Cells that have never expressed Lyve1-Cre and whose ancestral cells never expressed Lyve1-Cre are red fluorescent. (B) SC does not originate from lymphatics. Corresponding confocal planes of adult SC at the levels of the labeled tissues are shown for a Lyve1-Cre mTmG mouse. The lymphatics (Ly, arrowheads) and macrophages (arrows) are green fluorescent, indicating Lyve1-Cre–mediated recombination occurred as expected. Blood vessels (BV) of the LVP and the corneoscleral tissue are red fluorescent, showing that Lyve1-Cre was never expressed in these tissues. SC cells are also red (GFP/tdTomato panel). SC is outlined by a dotted line to help distinguish it from the corneoscleral tissue that surrounds it. The form of SC is clearly demonstrated by VECAD immunolabeling (bottom). The green cells are macrophages associated with SC and not SC itself (see Figure S6). Scale bar, 100 µm.
Figure 5
Figure 5. Lineage tracing using Wnt1-Cre shows SC does not originate from neural crest cells.
(A) Outcome of a genetic cross between a Wnt1-Cre mouse and the ROSA26R-mtmG (mTmG) Cre reporter mouse. Wnt1 is an early developmental marker for neural crest cells. CRE-mediated recombination indelibly labels neural crest-derived cells with GFP fluorescence in a backdrop of red fluorescent cells that are not of neural crest origin. TM, trabecular meshwork. (B) SC does not originate from neural crest cells. (Top) The tissues enveloping and adjacent to SC in Wnt1-Cre mtmG mouse. These tissues include corneoscleral tissue and TM. These tissue express GFP and are thus of neural crest origin. (Middle) Adult SC lacks GFP expression but expresses tdTomato, indicating that it is not derived from neural crest. VECAD labeling, shape, and location were used to identify SC (see Figure S7). A blood vessel connecting to the SC is also red fluorescent, showing BECs are not neural crest derived, as is true for all limbal vasculature (not shown). (Bottom) A merge of the top two panels. Scale bar, 100 µm.
Figure 6
Figure 6. SC development initiates by sprouting from blood vessels in the limbus.
(A) Cartoon representing an early stage in the development of SC. At P1 and P2, endothelial cells of both the LVP and the RVs form sprouts, which migrate into the zone where SC develops. Because this zone is between the LVP and RV, we have named it the “intermediate zone,” or IZ. The outer and inner surfaces of the wall of the eye are indicated. At this stage, the LVP circumscribes the eye superficially about 20 µm below the outer surface of the eye. The RV run radially around the eye approximately 60 µm below the outer surface of the eye and perpendicular to the LVP vessels. (B) Sprouts from the LVP and RV penetrating into the IZ. The top panel is a panoramic YZ view of a segment of the limbus from a Kdr-GFP eye at P1. GFP+ sprouts from both the LVP and RV are seen in the IZ. This panoramic view shows the entire tissue thickness. Boxed regions in the panoramic view are shown at a higher magnification in the three bottom panels. Note that the sprouts appear to have a leading tip cell and a trailing stalk-like structure (arrowheads). Scale bar, (top image) 40 µm and (bottom images) 20 µm.
Figure 7
Figure 7. Sprouts have leading tip cells and following stalk cells, as is characteristic of angiogenesis.
(A–B) Tip cells from the LVP penetrating into the deeper limbal tissue. (A) Depth coded maximum intensity 3D rendering of limbal region of a P2 eye stained with endomucin. The deepest, endomucin-positive tissue is colored cyan and the more superficial tissue is redder. (Left) Low-magnification image with tip cells emanating from the LVP. Their cyan color indicated that they are in the plane of the future SC. (Middle) The region bounded by the white box in the left panel at higher digital zoom. (Right) The region bounded by the white box in middle panel at higher digital zoom with the superficial layer electronically removed in Imaris to show the tip cells in greater detail. The color key indicates the depth code in relation to relative depth from the outside of the eye (In, closer to inside of the eye; out, closer to outside of the eye; see Figure S1). (B) (Left) Tip cell region from middle panel of (A) rendered using blend mode of Imaris. This provides density so that the characteristic tip cell filipodial structures are clearly evident. (Middle and Right) Progressively, the tip cell in greater detail. (C) Cartoon representing this stage of development but ignoring the RV and their sprouts for the sake of simplicity. This is in no way meant to suggest lesser importance of RV. Scale bar, (A and B, Left images), 20 µm and (A and B, middle and right images) 10 µm.
Figure 8
Figure 8. Macrophages are present at sites of tip cell interactions mediated by filopodia.
(A) Tip cells in the IZ interact through their filopodia, and macrophages are present at sites of tip cell interaction. All images are Z-projections of the future SC plane of a P2 eye. The numbers correspond to their location in that eye in Figure S10. (Left) Endomucin staining of tip cells and their filopodia (arrowheads). (Middle) IBA1 staining marks macrophages. (Right) A merge of the endomucin and IBA1 staining. The interacting filopodia clearly have associated macrophages. (B) Interacting filopodia between two tip cells that are coated with VECAD. The filopodia are intertwined. The numbers label distinct cells. Image was captured using the highly sensitive photon-counting mode on the confocal microscope. The cartoon represents these tip cell–macrophage interactions. RV and their sprouts are not shown for the sake of simplicity and in no way meant to suggest lesser importance of RV. Scale bar, (A) 20 µm and (B) 5 µm.
Figure 9
Figure 9. Filopodial interactions lead to interlacing of tip cells.
(Left) Depth coded 3D rendering of limbal region of a P2.5 eye shows four tip cells interlacing with each other in the future SC plane. (Right) Magnification of the region within the white box in the left panel shows a cluster of interacting tip cells ranging in colors from cyan to violet. The complex LVP is in magenta. Superficial Z-slices were removed digitally in Imaris to reveal the interlaced tip cells with greater clarity. In this view, it is clear that each of the pseudocolored tip cells is connected to its own sprout and these sprouts connect to the LVP. Although the cell borders cannot be always unambiguously ascertained with endomucin staining, the fact that four individual sprouts are connected to this cluster clearly indicates that it originated from at least four tip cells. (Bottom) The sprouts and cells have been pseudocolored for clarity (numbered 1–4). The tissue that is not pseudocolored does not connect to this cluster. Cartoon represents the interlacing of tip cells. For simplicity, RV and their sprouts are not shown, and this in no way is meant to suggest lesser importance of RV. The 3D coordinates are shown. Scale bar, (Top Left) 20 µm and (Top Right and pseudocolored image) 10 µm.
Figure 10
Figure 10. Cell clusters form from LVP and RV sprouts in the IZ.
(A) Panoramic YZ view of a limbal segment of a Kdr-GFP eye at P3. GFP+ cell clusters that are still attached to LVP, RV, or both colonize the IZ. The clusters indicated by arrows occupy different tissue planes, and so the entire tissue thickness is shown. (B, Left) Three boxed regions from (A) at high magnification. For each boxed region and for clarity, tissue planes that obscured the view of the continuous connection between each cell cluster in the IZ and its originating vascular bed were digitally removed. Cell clusters connected to RV (1), LVP (2), and to both LVP and RV (3) are shown. Arrows are at identical positions in the panoramic and high-magnification views and indicate recognizable features of each cluster. Connections to parent vasculature are indicated by arrowheads. (Right) XY images of the same cell clusters show numerous GFP+ cells (green) attached to each other at cell junctions marked by VECAD. These cell clusters are the first multicellular sign of a nascent SC. Scale bar, (A) 50 µm and (B) 30 µm.
Figure 11
Figure 11. Summary of early SC development.
The images show VECAD (yellow) immunolabeled cells in the IZ in the plane of the future SC at the developmental ages listed. The cartoons represent the corresponding stages. The development of SC starts by sprouting from the LVP and RV. RV and their sprouts have been left out of the cartoons for the sake of simplicity and in no way are meant to suggest lesser importance of RV. (A) As in angiogenesis, sprouts led by tip cells penetrate into the IZ all around the limbus. (B) However, in contrast to angiogenesis, multiple tip cells interact and form tip cell clusters (TCCs). (C) These local clusters of cells connect with each other to form a continuous structure encircling the entire limbus. We call this structure the rSC. (D) The number of cells in the rSC increases and the cellular chain branches. Scale bar, 20 µm.
Figure 12
Figure 12. The rSC begins to express Prox1 and to acquire a tube-like morphology.
Z-projection of confocal stacks encompassing the rSC from a Prox1-GFP eye at P4.5. VECAD immunostaining shows a region with branching of the rudimentary vessel (block arrows, equivalent to stage D in Figure 11). Prox1 is first expressed in the rSC at late P4. The branching rSC begins to acquire Prox1 expression as indicated by GFP+ cells (arrowhead). Higher Prox1 expression correlates with transition of rSC morphology from a sprouting chain of cells to a flattened tube (arrows). (Inset) DIC merged image showing that the tubular regions of the rSC have pockets of space filled with RBCs (black arrows). Scale bar, 50 µm.
Figure 13
Figure 13. Development from rSC to mature morphology.
(Left, A–E) Z-projections of confocal stacks encompassing the developing SC in Prox1-GFP eyes. (A) At P4.5 VECAD labeling shows multicellular sprouts (*) at the sides of the GFP + tubular rSC. These sprouts have no detectable Prox1 expression. (B) By P5, remodeling has formed a central core of PROX1+ flattened cells without any discernible internal space or RBCs. Further development continues by sprouting (*, Figure S13) from the central core. Dotted line delineates developing SC from autofluorescence arising from nearby tissue. (C) At P10, developing SC has expanded considerably in size, and maturation with lumen formation and polarization of PROX1 expression to the inner wall have begun (see Figure 15). The developing SC remains connected to the LVP (c) but no connections to the RV are detected after P5. (D) SC looks mature at P17 but continues to grow. (E) Adult SC. (Right) The cartoons distill the essential points of each stage. At P5 PROX1- sprouts are shown in magenta. At all developmental stages, the SC is connected to the LVP. The adult stage SC cartoon attached to the LVP is seen from the inner wall perspective, where the thin cells are a darker green to depict strong Prox1 expression. The SC shown below is from the outer wall perspective, with the paler green large cells having weak or no detectable PROX1 expression. BV, blood vessels; c, collector channels. Scale bar, 50 µm.
Figure 14
Figure 14. Cellular proliferation occurs during SC development.
(A–C) Z-projections of the presumptive SC plane at the indicated ages. The top panels at each age show a merged image of endomucin and Ki67 staining. The endomucin staining delineates the developing SC. Ki67 labels dividing cells, labeling both the developing SC and other cells. Bottom panels show endomucin and Ki67 double-labeled cells in the developing SC in blue (voxel overlap of endomucin and Ki67 in a Z-projection). The double-positive proliferating cells closely track the developing SC. Thus, SC growth involves cell proliferation. Scale bar, 50 µm.
Figure 15
Figure 15. Polarized wall morphology and lumen formation are occurring at P10.
(Left) Z-projection of high magnification confocal sections encompassing the developing SC in a Prox1-GFP mouse. (Right) XZ planes through the three regions numbered in the XY image. Each XZ plane is shown in its native state (above dotted line) and with a yellow fill marking regions with an obvious lumen (below dotted line). All sections are oriented with OW on top and IW on bottom. Varying degrees of lumen formation and maturation are evident. In 1, the lumen is almost complete and the IW and OW differentially express Prox1, with most of the OW no longer expressing detectable Prox1 (arrowheads, compare to 2). In 2 and 3, the lumen is less continuous and differing portions of OW still robustly express Prox1. The complete breaks in labeling of IW and OW towards the left of 2 and 3 are due to a bifurcation (bf; compare to XY image). Scale bar, 30 µm.
Figure 16
Figure 16. Blocking KDR function disrupts SC development at an early stage.
(A) Whole mounts from Tie2-GFP mice injected with either a control (nonspecific IgG) or KDR (alias VEGFR2) inhibiting antibody (DC101). The antibodies were injected from P0 to P5 and the tissues studied at P6. Images are Z-projections of stitched confocal stacks encompassing the entire limbus. The images were oriented identically based on the location of a distinctive blood vessel that is always located close to the asterisk but outside of the images. GFP+ tissues in the stacks have been depth coded. SC is coded in shades of blue (cyan to violet). Elements of the LVP are hued magenta. (Left) Control. The control had no effect on SC development and is indistinguishable from untreated eyes. At this stage, SC has a braided appearance but variable robustness in different regions, as it has formed to different degrees around the eye. Although there is variability, it is typically robust in the boxed regions on the left in these images. It is often less distinct around the 2 to 4 o'clock position and in the region around 9 o'clock. (Middle) 25 mg/kg DC101. SC is generally less developed and appears more tube-like than braided, and it is more fragmented. (Right) 50 mg/kg DC101. SC development is profoundly affected. It is highly fragmented, appearing as low complexity cellular clusters. (B) Higher magnification of boxed regions in (A). Although the control has regional variation in width and robustness of braiding, the DC101 treatment results in substantial developmental retardation. Thus, KDR has an important role in early SC development. Scale bar, (A) 300 µm and (B) 40 µm.
Figure 17
Figure 17. Blocking KDR function has a sustained disrupting effect on SC development.
Whole mounts from P12 mice injected with the control (IgG) or inhibitory (DC101) antibodies. Images are Z-projections of confocal stacks encompassing the SC. Multiple Z stacks were first stitched together to obtain a panoramic view of a region of the whole mounts. (Left) Control. The control IgG-treated eyes were indistinguishable from untreated eyes, with a robust and complex morphology. (Right) DC101 treated. The KDR inhibiting antibody had a profound effect on SC development. Representative examples from different mice are shown. Scale bar, 100 µm.
Figure 18
Figure 18. Schematic showing the stages of SC development by the novel process of canalogenesis.
Cartoons have been drawn for clarity and are not intended to suggest that most early sprouts arise from the LVP.

Comment in

References

    1. Tamm ER (2009) The trabecular meshwork outflow pathways: structural and functional aspects. Exp Eye Res 88: 648–655. - PubMed
    1. Overby DR, Stamer WD, Johnson M (2009) The changing paradigm of outflow resistance generation: towards synergistic models of the JCT and inner wall endothelium. Exp Eye Res 88: 656–670. - PMC - PubMed
    1. Streilein JW (1999) Immunologic privilege of the eye. Springer Semin Immunopathol 21: 95–111. - PubMed
    1. Johnson M (2006) ‘What controls aqueous humour outflow resistance?’. Exp Eye Res 82: 545–557. - PMC - PubMed
    1. Ramos RF, Hoying JB, Witte MH, Daniel Stamer W (2007) Schlemm's canal endothelia, lymphatic, or blood vasculature? J Glaucoma 16: 391–405. - PubMed

Publication types

MeSH terms

Substances

LinkOut - more resources