. 2014 Jul 30;5(14):5782-97.
doi: 10.18632/oncotarget.2164.

Thrombospondin 1 promotes an aggressive phenotype through epithelial-to-mesenchymal transition in human melanoma

Affiliations

Thrombospondin 1 promotes an aggressive phenotype through epithelial-to-mesenchymal transition in human melanoma

Aparna Jayachandran et al. Oncotarget. .

Abstract

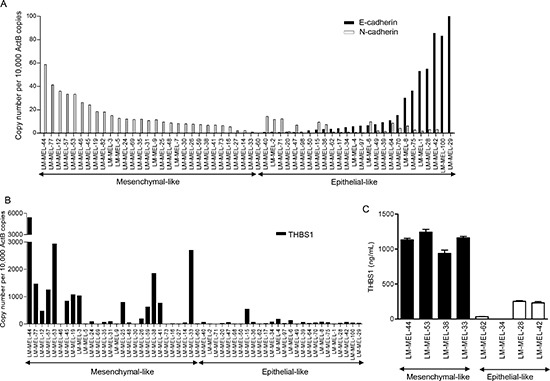
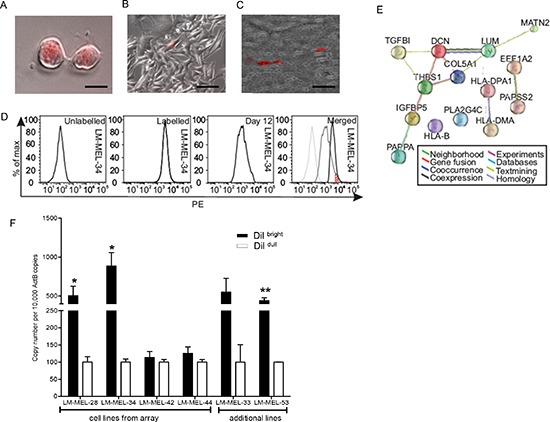
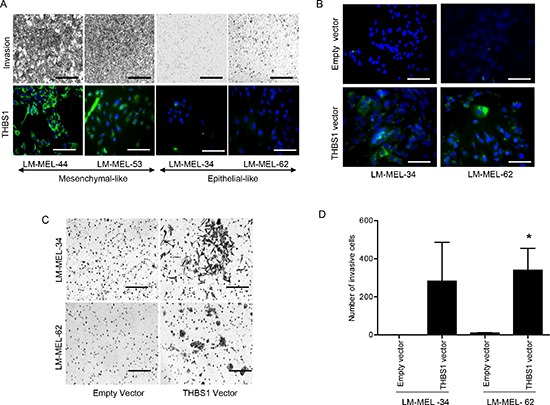
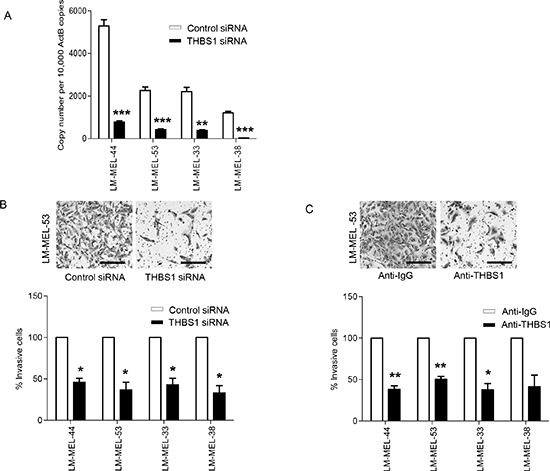
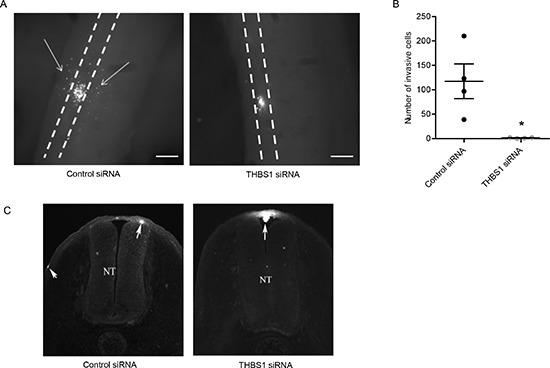
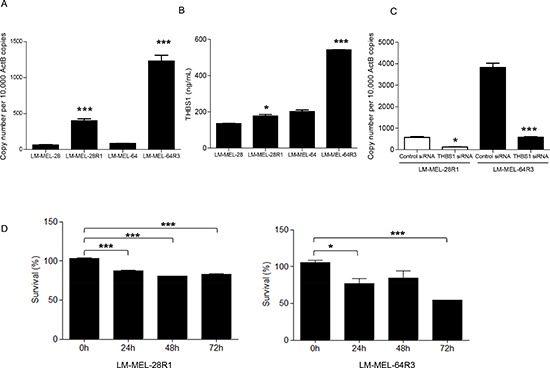
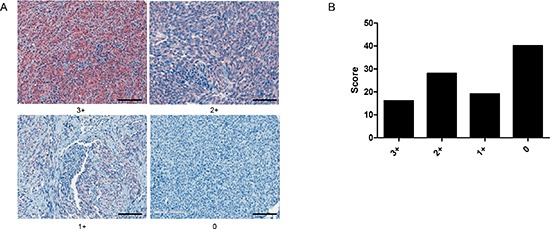
Epithelial-to-mesenchymal transition (EMT), in which epithelial cells loose their polarity and become motile mesenchymal cells, is a determinant of melanoma metastasis. We compared gene expression signatures of mesenchymal-like melanoma cells with those of epithelial-like melanoma cells, and identified Thrombospondin 1 (THBS1) as highly up-regulated in the mesenchymal phenotype. This study investigated whether THBS1, a major physiological activator of transforming growth factor (TGF)-beta, is involved in melanoma EMT-like process. We sought to examine expression patterns in distinct melanoma phenotypes including invasive, de-differentiated, label-retaining and drug resistant populations that are putatively associated with an EMT-like process. Here we show that THBS1 expression and secretion was elevated in melanoma cells exhibiting invasive, drug resistant, label retaining and mesenchymal phenotypes and correlated with reduced expression of genes involved in pigmentation. Elevated THBS1 levels were detected in Vemurafenib resistant melanoma cells and inhibition of THBS1 led to significantly reduced chemoresistance in melanoma cells. Notably, siRNA-mediated silencing of THBS1 and neutralizing antibody to THBS1 reduced invasion in mesenchymal-like melanoma cells, while ectopic THBS1 expression in epithelial-like melanoma cells enhanced invasion. Furthermore, the loss of THBS1 inhibited in vivo motility of melanoma cells within the embryonic chicken neural tube. In addition, we found aberrant THBS1 protein expression in metastatic melanoma tumor biopsies. These results implicate a role for THBS1 in EMT, and hence THBS1 may serve as a novel target for strategies aimed at the treatment of melanoma invasion and drug resistance.


Conflict of interest statement

No potential conflicts of interest are disclosed.

Figures

Figure 1
Figure 1. Classification of a panel of melanoma cells lines based on gene expression
qRT-PCR analysis revealed expression of (A) E- and N-cadherins and (B) THBS1 in a panel of 54 melanoma cell lines. (C) Media from 4 mesenchymal- and 4 epithelial-like melanoma cells were collected and subjected to THBS1 ELISA. ANOVA analysis of the two sets of cell lines was significant (p<0.005).
Figure 2
Figure 2. Expression of THBS1 in LRC sub-population within melanoma cell lines
Melanoma cell line, LM-MEL-34 labelled with CM-DiI was imaged after (A) 2 days (scale bar = 50μm) or (B) 14 days (scale bar = 100μm), respectively. (C) Melanoma cells from a patient with malignant melanoma were labelled with CM-Dil and injected subcutaneously into the flank of three animals. After three weeks, tumors were harvested and embedded in paraffin, cut into sections and examined by fluorescent microscopy (scale bar = 500μm). (D) Example of a flow profile of LM-MEL-34 cells unstained, 1 hour after CM-Dil labeling, 12 days after labeling, and merged histogram overlay (from left to right). The red striped area represents the population of cells referred to as LRC. LM-MEL−28, −34, −42 and −44 were sorted into Dilbright and Dildull cells 14 days after labeling with CM-Dil. RNA was subjected to genome-wide gene expression analysis using Illumina HT12 arrays. (E) Upregulated genes were employed to generate an evidence-based protein-interaction network in STRING and demonstrated connections between several ECM-related molecules with higher expression in the Dilbright cells. (F) Dilbright and Dildull cells from the same 4 lines and 2 additional cell lines were separated and qPCR was performed to evaluate expression of THBS1. Values are mean +/− SEM of three experiments in triplicate (* p<0.05, ** p<0.005).
Figure 3
Figure 3. THBS1 expression induces melanoma cell invasion
(A) Mesenchymal- and epithelial-like melanoma cells were subjected to invasion through matrigel-coated Boyden chambers. After 48 hours cells were fixed and images of invasive cells were taken (scale bar = 500μm) or stained using THBS1 antibody in conjunction with an Alexa-488 conjugated secondary antibody and visualized with a fluorescent microscope (scale bar = 100μm). (B) THBS1 protein expression in two clonally derived LM-MEL-34 and LM-MEL-62 cell lines and respective empty vector control was detected using immunostaining (scale bar = 100μm). (C) Invasiveness of epithelial-like cells with empty vector control or THBS-1 expression vector was determined (scale bar = 100μm). (D) The graphs show the total number of invasive cells counted. Values are mean +/− SEM of three experiments in triplicate (* p<0.05).
Figure 4
Figure 4. Targeting THBS1 results in loss of invasive potential of melanoma cells in vitro
(A) Melanoma cells were plated out and transfected with either 20nM control siRNA or THBS1 specific siRNA. After 72 hours RNA was extracted and THBS1 qRT-PCR was performed. (B) Melanoma cells were transfected as described and representative images of invasion in LM-MEL-53 are shown after 24 hours (scale bar = 100μm). The graphs show the total number of invasive cells counted and cell numbers from control were set to 100% and compared to THBS1 siRNA transfected cells. (C) Invasiveness of melanoma cells after treatment with control anti-IgG or anti-THBS1 antibodies was tested, images captured (scale bar = 100μm) and quantified as above. Values are mean +/− SEM of four independent experiments in triplicate (* p<0.05, ** p<0.005, *** p<0.0005).
Figure 5
Figure 5. RNAi mediated loss of THBS1 blocks motility in in vivo chick model
Melanoma cells were treated with CM-DiO, transfected with the indicated constructs and cultured as hanging drops to encourage aggregate formation. Similar sized aggregates were introduced into the neural tube of developing chicken and re-incubated within the egg for 2 days. (A) Embryos were harvested and fluorescence pictures from whole-mounts taken (scale bar = 50μm). White dotted line shows the outline of the neural tube and the white arrows indicate melanoma cells that migrated out of the neural tube and into the surrounding tissue. (B) Analysis of cell numbers infiltrating the surrounding tissue from several independent experiments (n=4 for control siRNA and THBS1 siRNA) (* p<0.05). (C) Images from cross-sections of embryos. White arrows indicate melanoma cells and NT denotes neural tube, dorsal is to the top.
Figure 6
Figure 6. Melanoma cells surviving treatment with BRAF V600E inhibitor up-regulate THBS1
THBS1 expression by qRT-PCR (A) and secretion by ELISA (B) in PLX4720 resistant LM-MEL-28R1 and LM-MEL-64R3 melanoma cell lines relative to their sensitive parental lines was determined. (C) LM-MEL-28R1 and LM-MEL-64R3 melanoma cell lines were treated with control or THBS1 siRNA and knockdown was evaluated with qRT-PCR and (D) percentage survival was quantified from absorbance obtained from MTS measurement. Bars are mean values +/− SEM from three independent experiments in triplicate (* p<0.05, ** p<0.005, *** p<0.0005).
Figure 7
Figure 7. THBS1 immunostaining in melanoma tumor tissue
(A) Localization of THBS1 in metastatic melanoma tumor biopsies. Representative tumors show score staining intensities (scale bar = 50μm). (B) Graph shows number of tumors scored.

References

    1. Miller AJ, Mihm MC., Jr Melanoma. N Engl J Med. 2006;355(1):51–65. - PubMed
    1. Lito P, Rosen N, Solit DB. Tumor adaptation and resistance to RAF inhibitors. Nat Med. 2013;19(11):1401–1409. - PubMed
    1. Villanueva J, Vultur A, Herlyn M. Resistance to BRAF inhibitors: unraveling mechanisms and future treatment options. Cancer Res. 2011;71(23):7137–7140. - PMC - PubMed
    1. Caramel J, Papadogeorgakis E, Hill L, Browne GJ, Richard G, Wierinckx A, Saldanha G, Osborne J, Hutchinson P, Tse G, Lachuer J, Puisieux A, Pringle JH, Ansieau S, Tulchinsky E. A switch in the expression of embryonic EMT-inducers drives the development of malignant melanoma. Cancer Cell. 2013;24(4):466–480. - PubMed
    1. Kim JE, Leung E, Baguley BC, Finlay GJ. Heterogeneity of expression of epithelial-mesenchymal transition markers in melanocytes and melanoma cell lines. Front Genet. 2013;4:97. - PMC - PubMed

Publication types

Substances