

Systematic permutation testing in GWAS pathway analyses: identification of genetic networks in dilated cardiomyopathy and ulcerative colitis
- PMID: 25052024
- PMCID: PMC4223581
- DOI: 10.1186/1471-2164-15-622
Systematic permutation testing in GWAS pathway analyses: identification of genetic networks in dilated cardiomyopathy and ulcerative colitis
Abstract
Background: Genome wide association studies (GWAS) are applied to identify genetic loci, which are associated with complex traits and human diseases. Analogous to the evolution of gene expression analyses, pathway analyses have emerged as important tools to uncover functional networks of genome-wide association data. Usually, pathway analyses combine statistical methods with a priori available biological knowledge. To determine significance thresholds for associated pathways, correction for multiple testing and over-representation permutation testing is applied.
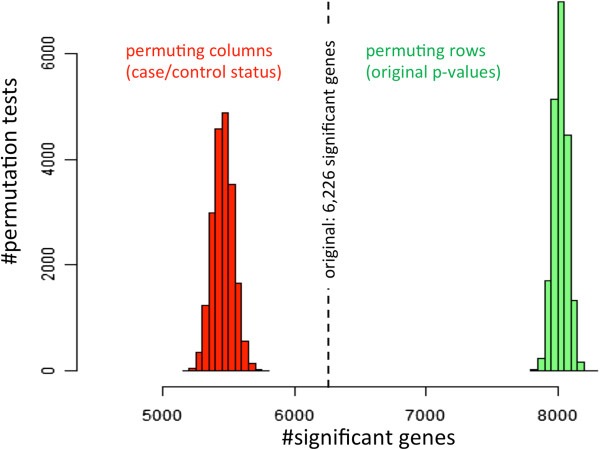
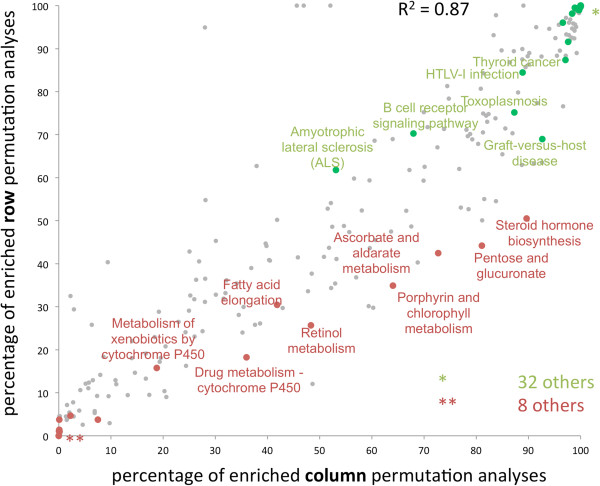
Results: We systematically investigated the impact of three different permutation test approaches for over-representation analysis to detect false positive pathway candidates and evaluate them on genome-wide association data of Dilated Cardiomyopathy (DCM) and Ulcerative Colitis (UC). Our results provide evidence that the gold standard - permuting the case-control status - effectively improves specificity of GWAS pathway analysis. Although permutation of SNPs does not maintain linkage disequilibrium (LD), these permutations represent an alternative for GWAS data when case-control permutations are not possible. Gene permutations, however, did not add significantly to the specificity. Finally, we provide estimates on the required number of permutations for the investigated approaches.
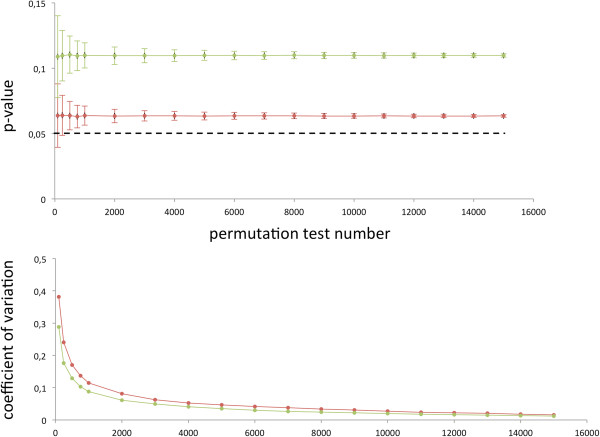
Conclusions: To discover potential false positive functional pathway candidates and to support the results from standard statistical tests such as the Hypergeometric test, permutation tests of case control data should be carried out. The most reasonable alternative was case-control permutation, if this is not possible, SNP permutations may be carried out. Our study also demonstrates that significance values converge rapidly with an increasing number of permutations. By applying the described statistical framework we were able to discover axon guidance, focal adhesion and calcium signaling as important DCM-related pathways and Intestinal immune network for IgA production as most significant UC pathway.
Figures
References
-
- Klein RJ, Zeiss C, Chew EY, Tsai JY, Sackler RS, Haynes C, Henning AK, SanGiovanni JP, Mane SM, Mayne ST, Bracken MB, Ferris FL, Ott J, Barnstable C, Hoh J. Complement factor H polymorphism in age-related macular degeneration. Science. 2005;308(5720):385–389. doi: 10.1126/science.1109557. - DOI - PMC - PubMed
-
- Haines JL, Hauser MA, Schmidt S, Scott WK, Olson LM, Gallins P, Spencer KL, Kwan SY, Noureddine M, Gilbert JR, Schnetz-Boutaud N, Agarwal A, Postel EA, Pericak-Vance MA. Complement factor H variant increases the risk of age-related macular degeneration. Science. 2005;308(5720):419–421. doi: 10.1126/science.1110359. - DOI - PubMed
-
- Teslovich TM, Musunuru K, Smith AV, Edmondson AC, Stylianou IM, Koseki M, Pirruccello JP, Ripatti S, Chasman DI, Willer CJ, Johansen CT, Fouchier SW, Isaacs A, Peloso GM, Barbalic M, Ricketts SL, Bis JC, Aulchenko YS, Thorleifsson G, Feitosa MF, Chambers J, Orho-Melander M, Melander O, Johnson T, Li X, Guo X, Li M, Shin Cho Y, Jin Go M, Jin Kim Y. Biological, clinical and population relevance of 95 loci for blood lipids. Nature. 2010;466(7307):707–713. doi: 10.1038/nature09270. - DOI - PMC - PubMed
Publication types
MeSH terms
LinkOut - more resources
Full Text Sources
Other Literature Sources
Medical
Research Materials
Miscellaneous
