. 2014 Oct;11(10):1808-1818.
doi: 10.1016/j.hrthm.2014.05.037. Epub 2014 Jun 2.

From beat rate variability in induced pluripotent stem cell-derived pacemaker cells to heart rate variability in human subjects

Affiliations

From beat rate variability in induced pluripotent stem cell-derived pacemaker cells to heart rate variability in human subjects

Meital Ben-Ari et al. Heart Rhythm. 2014 Oct.

Abstract

Background: We previously reported that induced pluripotent stem cell-derived cardiomyocytes manifest beat rate variability (BRV) resembling heart rate variability (HRV) in the human sinoatrial node. We now hypothesized the BRV-HRV continuum originates in pacemaker cells.

Objective: To investigate whether cellular BRV is a source of HRV dynamics, we hypothesized 3 levels of interaction among different cardiomyocyte entities: (1) single pacemaker cells, (2) networks of electrically coupled pacemaker cells, and (3) the in situ sinoatrial node.

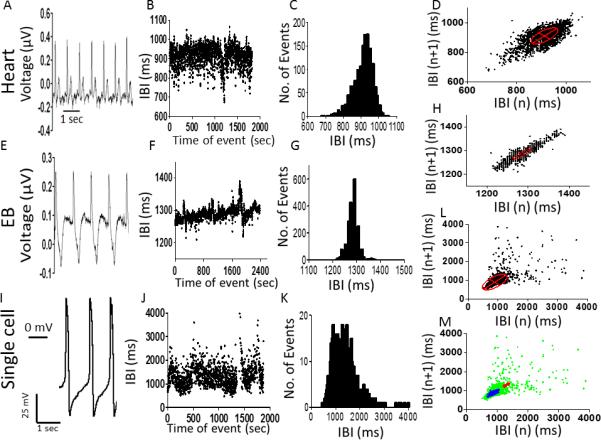
Methods: We measured BRV/HRV properties in single pacemaker cells, induced pluripotent stem cell-derived contracting embryoid bodies (EBs), and electrocardiograms from the same individual.

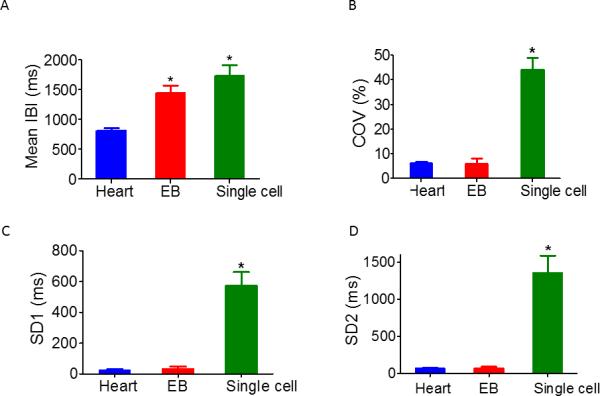
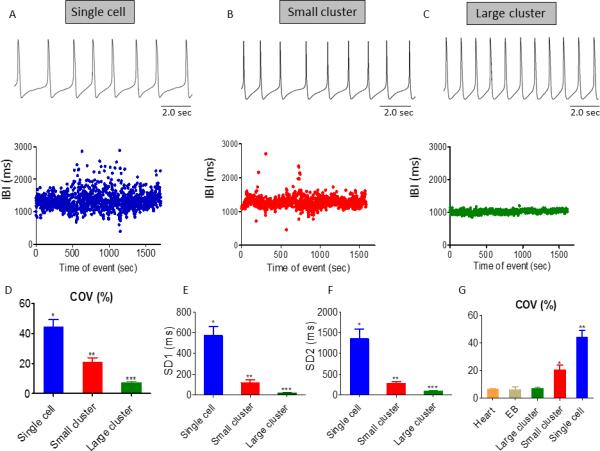
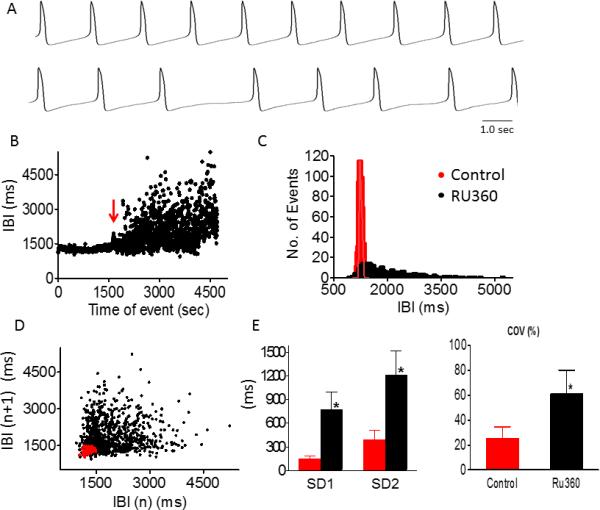
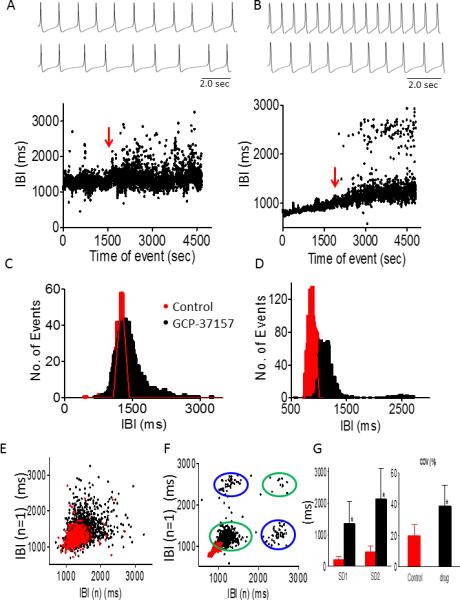
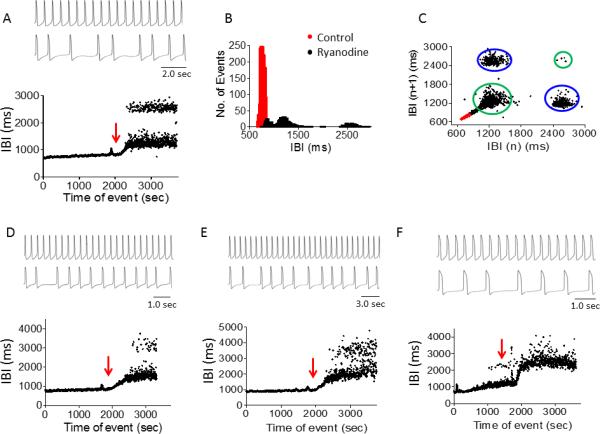
Results: Pronounced BRV/HRV was present at all 3 levels. The coefficient of variance of interbeat intervals and Poincaré plot indices SD1 and SD2 for single cells were 20 times greater than those for EBs (P < .05) and the in situ heart (the latter two were similar; P > .05). We also compared BRV magnitude among single cells, small EBs (~5-10 cells), and larger EBs (>10 cells): BRV indices progressively increased with the decrease in the cell number (P < .05). Disrupting intracellular Ca(2+) handling markedly augmented BRV magnitude, revealing a unique bimodal firing pattern, suggesting that intracellular mechanisms contribute to BRV/HRV and the fractal behavior of heart rhythm.

Conclusion: The decreased BRV magnitude in transitioning from the single cell to the EB suggests that the HRV of in situ hearts originates from the summation and integration of multiple cell-based oscillators. Hence, complex interactions among multiple pacemaker cells and intracellular Ca(2+) handling determine HRV in humans and cardiomyocyte networks.

Keywords: Cardiac myocytes; Electrophysiology; Heart rate; Heart rate variability; Induced pluripotent stem cells.


Figures

Figure 1
Figure 1
Electrical activity, inter-beat intervals (IBIs) and Poincaré plots analysis at three levels: [A-D] in situ heart; [E-H] spontaneously contracting embryoid body (EB); [I-L] single cardiomyocyte. [A], [E], [I]: Representative electrocardiogram, extracellular electrogram and action potentials, respectively. [B], [F], [J]: IBIs time series. [C], [G], [K]: Histogram distribution of IBIs. [D], [H], [L]: Poincaré plots of IBI. [M]: Combined Poincaré plots. The minor axis (SD1) of the ellipse represents the standard deviation (SD) of short-term IBI variability; the major axis (SD2) represents the standard deviation of long-term IBI variability. Recordings from volunteer #201201.
Figure 2
Figure 2
Comparisons of BRV/HRV magnitude at the three levels. Summary of Mean IBI [A], Coefficient of variance (COV) of IBIs (IBI COV) [B], SD1 [C] and SD2 [D] of Poincaré plots in heart in situ (n=5 individuals), contracting EBs (n=11), and single cardiomyocytes (n=22). In [A] *P <0.05, heart versus EB and single cell. In [B-D] *P <0.05, single cell versus EB and heart.
Figure 3
Figure 3
Comparisons of BRV/HRV magnitude among single cardiomyocytes, a small (5-10 cells) and a larger cluster (>10 cells). [A-C] Representative experiments depicting action potential (AP) recordings and their corresponding IBIs versus time plot in single cardiomyocyte, small and larger cluster, respectively. [D-F] Summary of IBI COV [D], SD1 [E] and SD2 [F] of Poincaré plots in single cardiomyocytes (n=28 individuals), small cluster (n=22) and larger cluster (n=13). In [D-F], *P <0.05, single cardiomyocytes versus small clusters versus large clusters. [G]: Summary of IBI COV in ECG (n=5), electrograms (n=11), and AP of large (n=13) and small (n=22) cardiomyocyte clusters, and single cardiomyocytes (n=28). In [G], *P <0.05, single cardiomyocyte versus small contracting EBs versus large contracting EBs, EB and Heart.
Figure 4
Figure 4
Effect of Ru360 on BRV magnitude of a small iPSC-CM cluster. Representative AP recordings in small cluster iPSC-CM, in absence (upper panel) and presence (lower panel) of 20 μM Ru360 [A], IBI analysis [B], histogram distribution of IBIs [C], Poincaré plots of IBI [D] and summary of IBIs COV, SD1 and SD2 [E], in absence (red dotted) and presence (black dotted) of Ru360. Ru360 increased IBI COV, SD1 and SD2 compared to control (*P<0.05, n=5). Red arrow indicates drug application.
Figure 5
Figure 5
Effect of GCP-37157 (1 μM) on BRV magnitude in small iPSC-CM clusters. GCP-37157 increased BRV magnitude (n=8) and induced a bi-modal firing pattern (n=2). Representative AP recordings in absence (upper panel) and presence (middle panel) of 1 μM GCP-37157 and corresponding IBIs time plots (lower panel) of normal firing pattern [A] and a bimodal pattern [B], histogram distributions of IBIs [C-D], and Poincaré plots [E-F]. [G] Summary of effect of GCP-37157 on IBIs COV, SD1 and SD2. *P<0.05 GCP-37157 versus control (n=8). Red arrow indicates drug application.
Figure 6
Figure 6
Effect of ryanodine (1 μM) on IBIs time series in small iPSC-CM clusters. Ryanodine induced a bimodal firing pattern (n=3) and increased BRV magnitude (n=1). [A-C] Representative experiment showing AP recording in absence (upper panel) and presence (middle panel) of ryanodine and a corresponding IBI time plot (lower panel) [A], IBIs histogram distribution [B] and Poincaré plots [C]. [D-E] Two additional experiments showing ryanodine-induced bimodality. [F] Ryanodine increased IBIs dispersion in 1 of 4 experiments. Red arrow indicates ryanodine application.

References

    1. Acharya UR, Joseph KP, Kannathal N, Lim CM, Suri JS. Heart rate variability: a review. Med Bio Eng Comput. 2006;44:1031–1051. - PubMed
    1. Krstacic G, Parati G, Gamberger D, Castiglioni P, Krstacic A, Steiner R. Heart rate variability and nonlinear dynamic analysis in patients with stress-induced cardiomyopathy. Med Biol Eng Comput. 2012;50:1037–1046. - PubMed
    1. Goldberger AL, Amaral LAN, Hausdorff JM, Ivanov PC, Peng CK, Stanley HE. Fractal dynamics in physiology: Alterations with disease and aging. Proc Natl Acad Sci U S A. 2002;99(Suppl. 1):2466–2472. - PMC - PubMed
    1. McSharry PE, Malamud BD. Quantifying self-similarity in cardiac inter-beat interval time series. Comput Cardiol. 2005;32:459–462.
    1. Bigger JT, Jr, Steinman RC, Rolnitzky LM, Fleiss JL, Albrecht P, Cohen RJ. Power law behavior of RR-interval variability in healthy middle-aged persons, patients with recent acute myocardial infarction, and patients with heart transplants. Circulation. 1996;93:2142–2151. - PubMed

Publication types