. 2014 Aug;141(15):3093-101.
doi: 10.1242/dev.110601.

Single cell dissection of early kidney development: multilineage priming

Affiliations

Single cell dissection of early kidney development: multilineage priming

Eric W Brunskill et al. Development. 2014 Aug.

Abstract

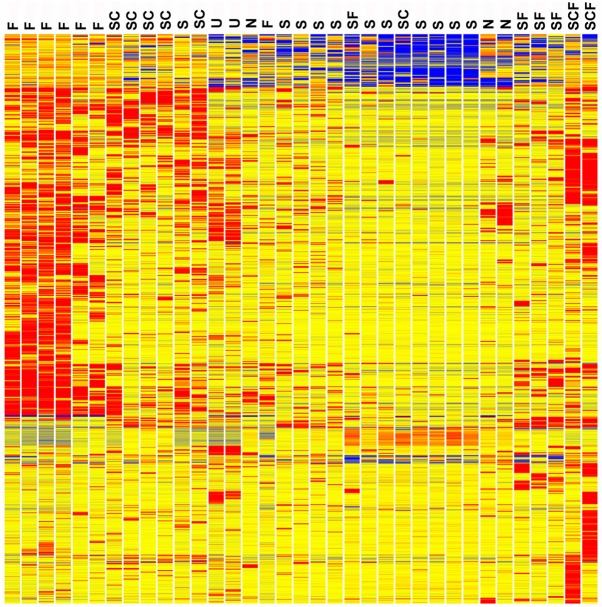
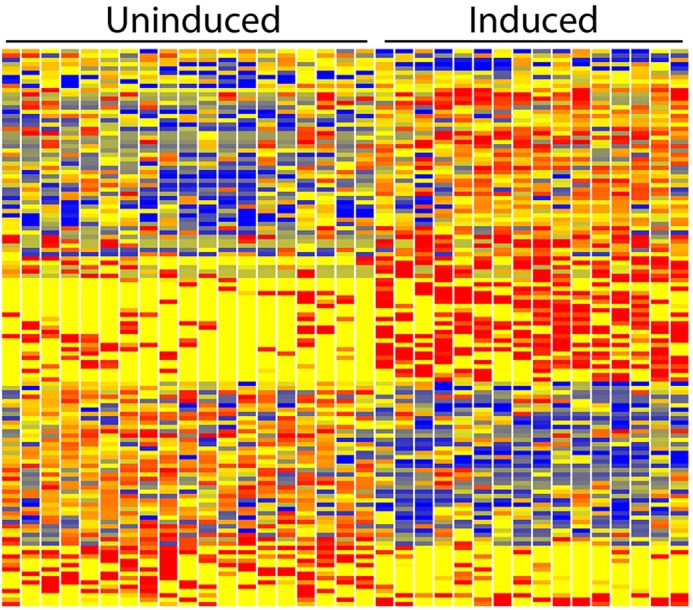
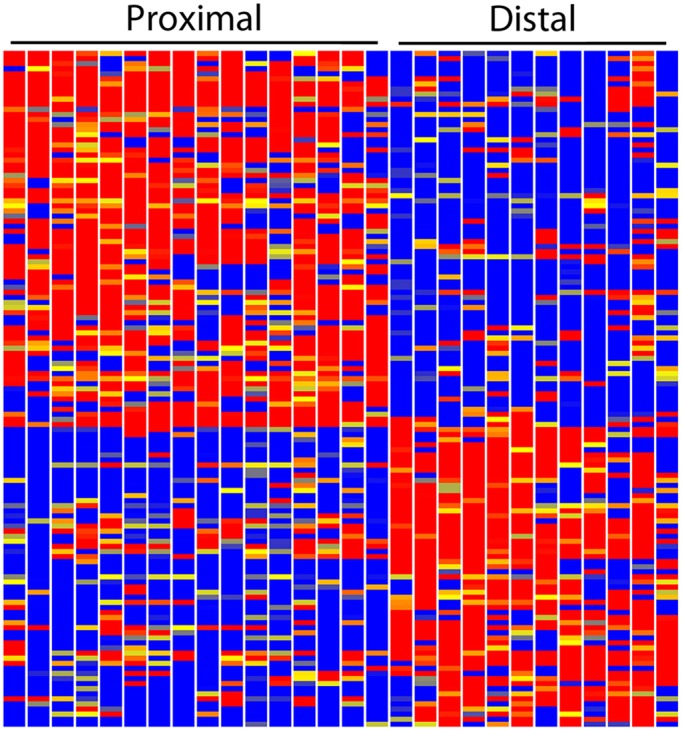
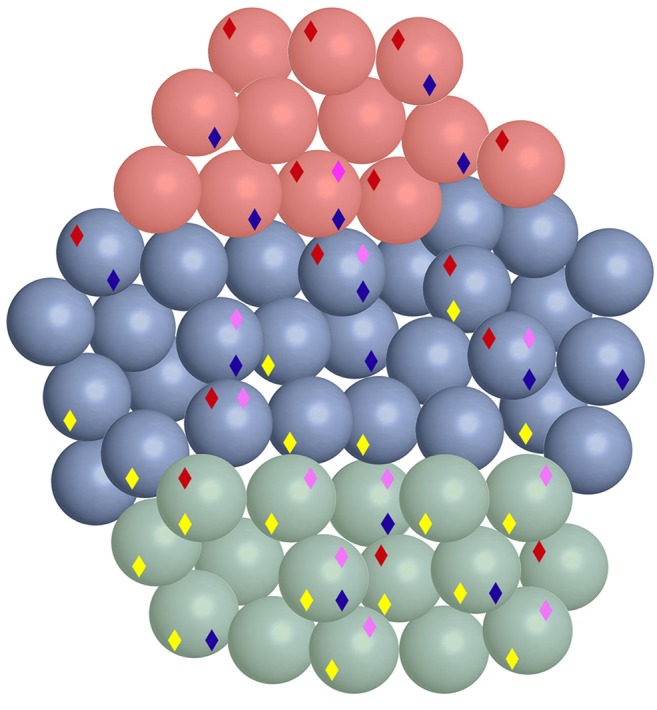
We used a single cell RNA-seq strategy to create an atlas of gene expression patterns in the developing kidney. At several stages of kidney development, histologically uniform populations of cells give rise to multiple distinct lineages. We performed single cell RNA-seq analysis of total mouse kidneys at E11.5 and E12.5, as well as the renal vesicles at P4. We define an early stage of progenitor cell induction driven primarily by gene repression. Surprising stochastic expression of marker genes associated with differentiated cell types was observed in E11.5 progenitors. We provide a global view of the polarized gene expression already present in the renal vesicle, the first epithelial precursor of the nephron. We show that Hox gene read-through transcripts can be spliced to produce intergenic homeobox swaps. We also identify a surprising number of genes with partially degraded noncoding RNA. Perhaps most interesting, at early developmental times single cells often expressed genes related to several developmental pathways. This provides powerful evidence that initial organogenesis involves a process of multilineage priming. This is followed by a combination of gene repression, which turns off the genes associated with most possible lineages, and the activation of increasing numbers of genes driving the chosen developmental direction.

Keywords: Kidney development; Mouse; Multilineage priming; Single cell analysis.


Figures

Fig. 1.
Fig. 1.
Heatmap of differentially expressed genes for 33 single cells from E11.5 metanephric mesenchyme. Cells are labeled according to Foxd1 (F), Six2 (S) and Cited1 (C), expression. The induced Six2-only cells (S) show a large number of genes with reduced expression compared with the uninduced Six2 plus Cited1 (SC) cells. The cells with both Six2 and Foxd1 (SF) most closely resemble the Six2 only (S) cells in gene expression profile. It is also interesting to note that the Foxd1 (F) cells are distinct from the other cells in their high level expression of many genes. U indicates universal standard RNA made from entire newborn mice. Cells that did not express Six2, Foxd1 or Cited1 are marked N. Red, blue and yellow indicate high, low and intermediate expression levels, respectively. Clustering was based on the entire gene expression pattern and was not based on just Six2, Foxd1 and Cited1 expression.
Fig. 2.
Fig. 2.
Cells expressing both Foxd1 and Six2. Cells expressing both Six2 and Foxd1 protein were present, but rarer than predicted by the transcriptional profiling. (A) A Foxd1-Cre transgenic mouse was mated to a floxed stop Rosa26-lacZ reporter mouse, with the resulting kidneys primarily showing stromal cell labeling, as expected (arrowhead), but with some tubular nephron epithelial cells also labeled (arrow). The counterstain used was nuclear Fast Red. (B-D) E11.5 kidney immunostained for Six2 (red) and Foxd1. The expression of Foxd1 was detected using a Foxd1-GFP-Cre knock-in mouse and GFP antibody. Two positive cells near the periphery of the Six2-positive population are marked with arrows. (E-G) E15.5 Foxd1-GFP-Cre knock-in embryos were immunostained for Six2 and GFP. A rare double-labeled cell, again at the periphery of the Six2-positive cells, is marked with an arrow.
Fig. 3.
Fig. 3.
E11.5 MM cells show stochastic expression of markers of differentiated kidney cell types. The arrow shows a single cell with a strong immunostaining signal for Mafb (pink), a marker of glomerular podocytes. Blue, DAPI; green, Six2.
Fig. 4.
Fig. 4.
RNA-seq defined transcription and RNA processing patterns. (A) Foxd1. Cell 25 showed unexpected splicing (arrow) for this ‘intronless’ gene. Cell 50 showed transcripts restricted to the 3′ UTR (arrow), suggesting an absence of coding function. (B) Six2. Each cell shows a unique pattern of transcription/processing for the opposite strand (OS) LincRNA located 5′ of the Six2 gene. Cells 12 and 13 only showed transcripts from the 3′ exon. (C) Hox genes. Cell 4 showed intergenic splicing. Sequences within the second Hoxd12 exon served as a cryptic splice donor, providing an in-frame connection to the Hoxd11 second exon, resulting in a homeobox swap. Cell 29 used two novel exons, which were spliced with the second exon of Hoxd11. The positions of the genes, as per the UCSC genome browser are shown in blue, with introns marked by the lightest shade, and UTR sequences shown in the darkest shade. Arrows show unexpected splice events and the 3′ UTR transcripts of Foxd1.
Fig. 5.
Fig. 5.
Heatmap of differential gene expression of E12.5 uninduced and induced CM single cells. Of interest, at this stage the induction process shows a combination of both strong gene activation and repression. This is in contrast with E11.5, where the predominant feature was gene repression. Red, blue and yellow indicate high, low and intermediate expression levels.
Fig. 6.
Fig. 6.
Heatmap showing polarized gene expression of the renal vesicle. The 16 single-cell replicates of the proximal RV and the 12 single-cell replicates of the distal RV show remarkably consistent differences in the expression levels of a large number of genes. Red, blue and yellow indicate high, low and intermediate expression levels.
Fig. 7.
Fig. 7.
Multilineage priming of renal vesicle cells. The 58 RV single cells are color coded: proximal (green), distal (red) and equatorial (blue). Diamonds indicate gene expression patterns reflecting distinct differentiated cell types: yellow, podocytes; purple, proximal tubules; blue, parietal epithelial cell; red, distal tubule. Of interest, many cells show dual character, indicating multilineage priming.

References

    1. Akashi K., Traver D., Miyamoto T., Weissman I. L. (2000). A clonogenic common myeloid progenitor that gives rise to all myeloid lineages. Nature 404, 193-197 10.1038/35004599 - DOI - PubMed
    1. Azuara V., Perry P., Sauer S., Spivakov M., Jørgensen H. F., John R. M., Gouti M., Casanova M., Warnes G., Merkenschlager M., et al. (2006). Chromatin signatures of pluripotent cell lines. Nat. Cell Biol. 8, 532-538 10.1038/ncb1403 - DOI - PubMed
    1. Boyle S., Misfeldt A., Chandler K. J., Deal K. K., Southard-Smith E. M., Mortlock D. P., Baldwin H. S., de Caestecker M. (2008). Fate mapping using Cited1-CreERT2 mice demonstrates that the cap mesenchyme contains self-renewing progenitor cells and gives rise exclusively to nephronic epithelia. Dev. Biol. 313, 234-245 10.1016/j.ydbio.2007.10.014 - DOI - PMC - PubMed
    1. Brunskill E. W., Potter S. S. (2010). Gene expression programs of mouse endothelial cells in kidney development and disease. PLoS ONE 5, e12034 10.1371/journal.pone.0012034 - DOI - PMC - PubMed
    1. Brunskill E. W., Potter S. S. (2012a). Changes in the gene expression programs of renal mesangial cells during diabetic nephropathy. BMC Nephrol. 13, 70 10.1186/1471-2369-13-70 - DOI - PMC - PubMed

Publication types