. 2014 Sep;24(9):1485-96.
doi: 10.1101/gr.169532.113. Epub 2014 Jul 22.

Extreme expansion of the olfactory receptor gene repertoire in African elephants and evolutionary dynamics of orthologous gene groups in 13 placental mammals

Affiliations

Extreme expansion of the olfactory receptor gene repertoire in African elephants and evolutionary dynamics of orthologous gene groups in 13 placental mammals

Yoshihito Niimura et al. Genome Res. 2014 Sep.

Erratum in

Abstract

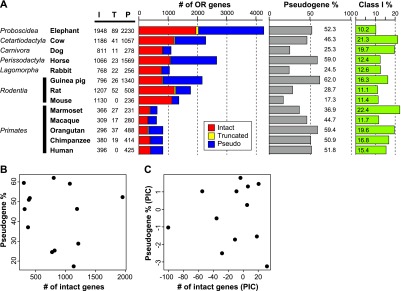
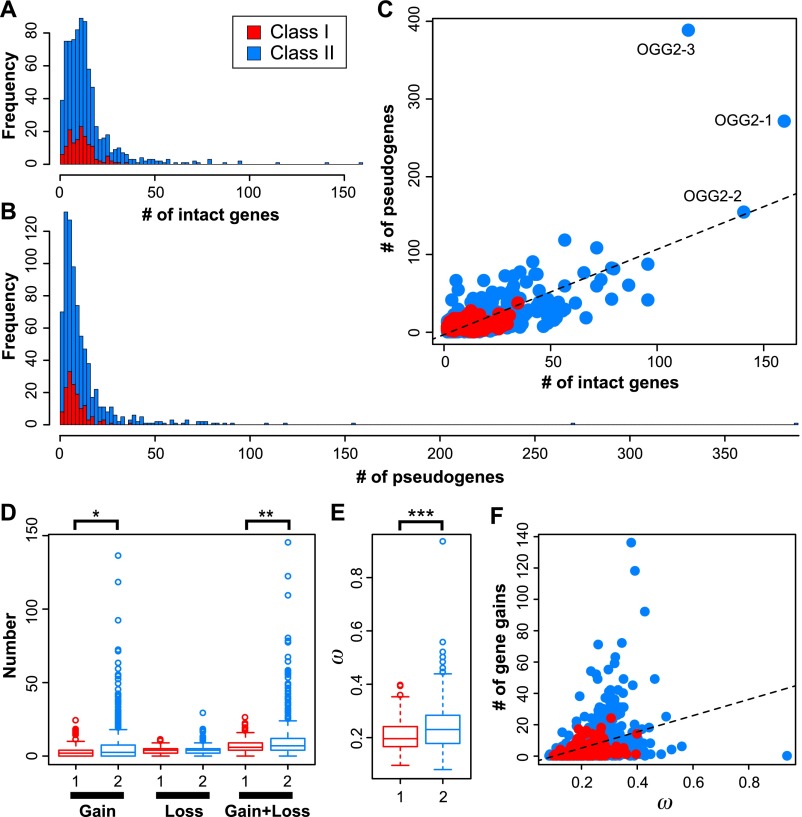
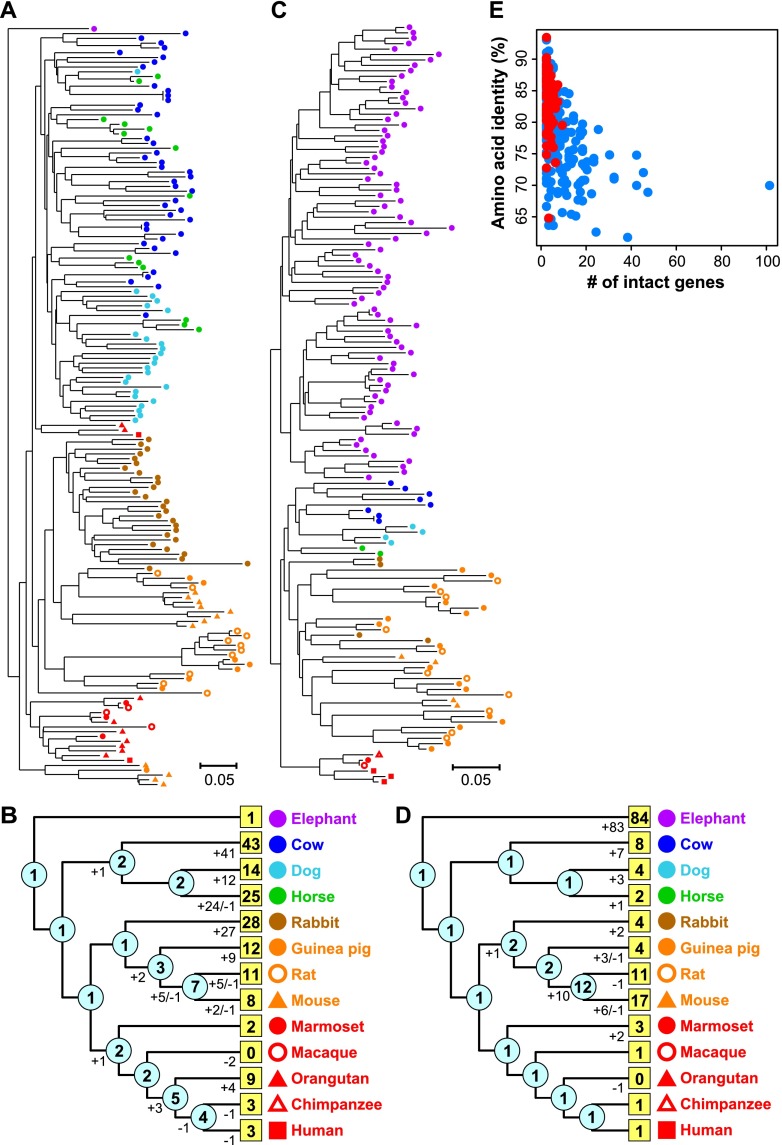
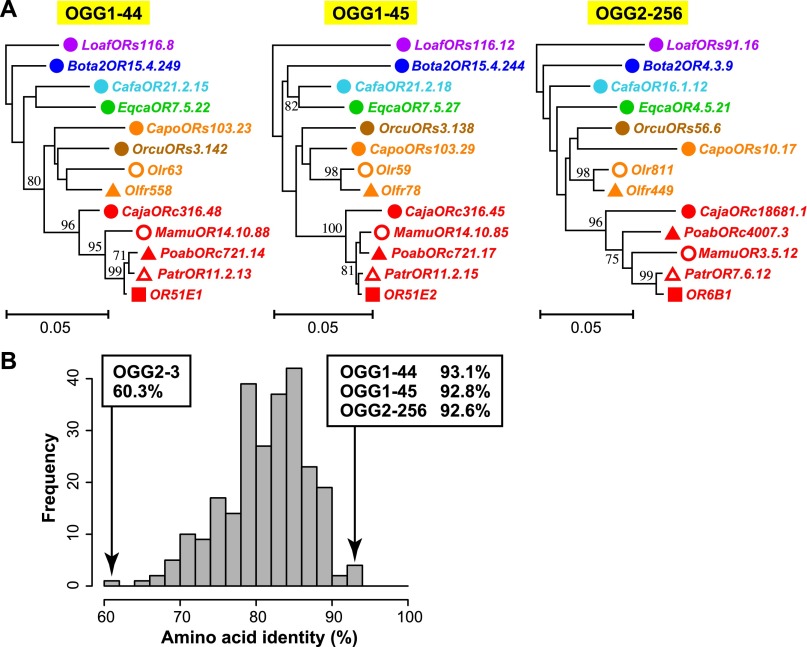
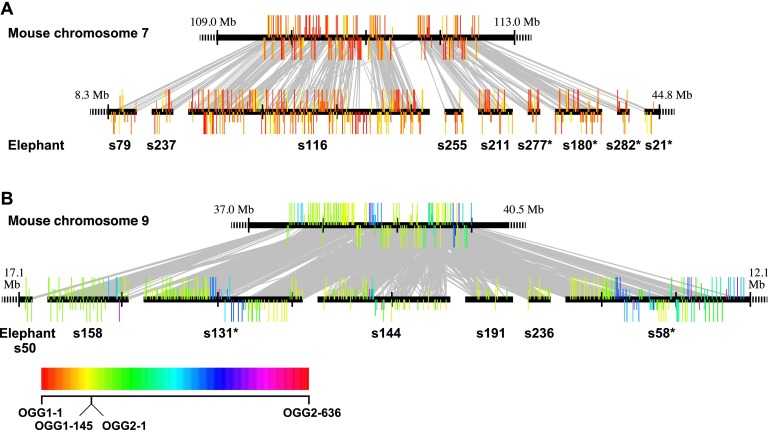
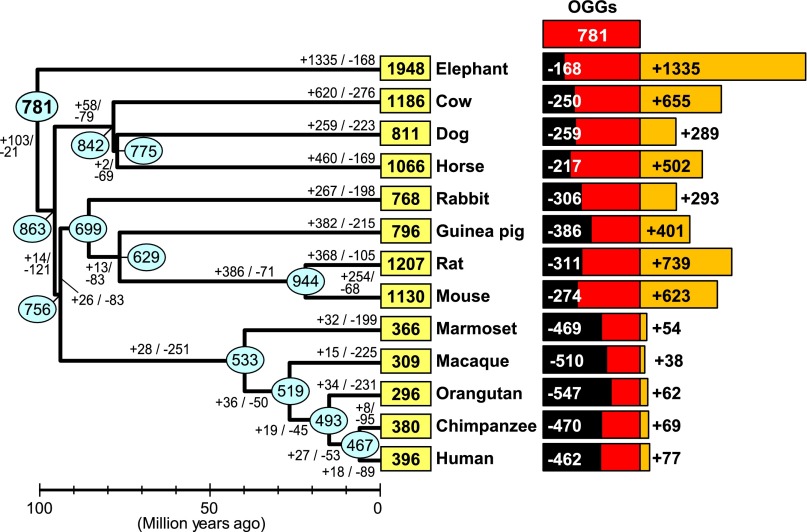
Olfactory receptors (ORs) detect odors in the environment, and OR genes constitute the largest multigene family in mammals. Numbers of OR genes vary greatly among species--reflecting the respective species' lifestyles--and this variation is caused by frequent gene gains and losses during evolution. However, whether the extent of gene gains/losses varies among individual gene lineages and what might generate such variation is unknown. To answer these questions, we used a newly developed phylogeny-based method to classify >10,000 intact OR genes from 13 placental mammal species into 781 orthologous gene groups (OGGs); we then compared the OGGs. Interestingly, African elephants had a surprisingly large repertoire (∼ 2000) of functional OR genes encoded in enlarged gene clusters. Additionally, OR gene lineages that experienced more gene duplication had weaker purifying selection, and Class II OR genes have evolved more dynamically than those in Class I. Some OGGs were highly expanded in a lineage-specific manner, while only three OGGs showed complete one-to-one orthology among the 13 species without any gene gains/losses. These three OGGs also exhibited highly conserved amino acid sequences; therefore, ORs in these OGGs may have physiologically important functions common to every placental mammal. This study provides a basis for inferring OR functions from evolutionary trajectory.


Figures

Figure 1.
Figure 1.
Numbers of OR genes in the genome sequence from 13 placental mammal species. (A) “I,” “T,” and “P” represent the number of intact genes, truncated genes, and pseudogenes, respectively. An intact gene was defined as a sequence starting from an initiation codon and ending with a stop codon that did not contain any disrupting mutations. A pseudogene was defined as a sequence with a nonsense mutation, frameshift, deletion within conserved regions, or some combination thereof. A truncated gene was defined as a partial, intact sequence located at a contig end. An intact gene was assumed to be functional, while a truncated gene was presumed to be either a functional gene or a pseudogene. The fraction of OR pseudogenes was calculated as the number of OR pseudogenes divided by the total number of OR genes. The fraction of Class I genes was calculated as the number of intact Class I genes divided by the total number of intact OR genes. Dog and rat data were taken from Niimura and Nei (2007), and the data for the five primates were from Matsui et al. (2010). (B) There was no significant correlation between the number of intact OR genes within a genome and the fraction of OR pseudogenes within that same genome among these 13 species (r = −0.137; P = 0.655); (C) again, there was no significant correlation (r = −0.003; P = 0.992) after the comparative method of phylogenetically independent constants (PICs) was used to remove phylogenetic dependence (Felsenstein 1985).
Figure 2.
Figure 2.
Distribution of the total number of OR genes—(A) intact genes and (B) pseudogenes—belonging to each of the 781 OGGs found among 13 placental mammal species. Red and blue indicate Class I and Class II genes, respectively (A–F). (C) The number of intact genes was positively correlated with the number of pseudogenes belonging to the respective OGG (r = 0.731); the dashed line indicates the regression line. (D,E) Boxplots of comparison between Class I (“1”; red) and Class II (“2”; blue) OGGs for estimated numbers of gene gains and losses (D) and estimated ω values (E). (*) P < 0.05, (**) P < 0.01, and (***) P < 0.001. (F) The ω value for an OGG was positively correlated with the number of intact genes in the respective OGG (r = 0.346; P < 2.2 × 10⁻¹⁶); the dashed line indicates the regression line.
Figure 3.
Figure 3.
Expanded OGGs. Neighbor-joining (NJ) phylogenetic trees were constructed from all intact OR genes in OGG2-1 (A) and OGG2-2 (C). In each tree (A,C), a colored symbol indicates a gene from the species depicted in B and D. Each scale bar indicates the number of amino acid substitutions per site. Gene names and bootstrap values are shown in Supplemental Figure S5A,B. (B,D) Number of gene gains and losses in each branch and the number of genes at ancestral nodes (shown in cyan circles) calculated from the OGG2-1 (A) and OGG2-2 (C) trees, respectively, by the reconciled-tree method (Niimura and Nei 2007). A number in a yellow box indicates the number of intact OR genes in each species belonging to each OGG. (E) For each OGG, the total number of intact genes in elephant and mouse within respective OGGs was negatively correlated with amino acid sequence identity between elephant and mouse among intact OR genes within the respective OGGs (rs = −0.52; P < 2.2 × 10⁻¹⁶). In all, 414 OGGs that contained at least one intact gene from both elephant and mouse were considered. When an OGG included two or more genes from either or both species, the mean of the amino acid sequence identities for all possible interspecies combinations of genes was used.
Figure 4.
Figure 4.
Conserved OGGs showing complete one-to-one orthology. (A) NJ phylogenetic trees for OGG1-44, OGG1-45, and OGG2-256. A colored symbol of a gene name indicates a species depicted in Figure 3B,D. Each scale bar indicates the number of amino acid substitutions per site. Bootstrap values obtained from 500 resamplings are shown only for the nodes with bootstrap values >70%. (B) Distribution of amino acid sequence identities between intact human and mouse OR genes for 252 OGGs containing at least one intact gene from both human and mouse. Note that pseudogenes and truncated genes were not used for the calculation of amino acid sequence identity. When an OGG included two or more genes from either or both species, the mean of the amino acid sequence identities for all possible interspecies combinations of genes was used. The OGGs with the three highest amino acid sequence identity values and that with the lowest value are shown with the respective percent identity. The mean and the median amino acid sequence identity among the 252 OGGs are 81.3% and 82.1%, respectively.
Figure 5.
Figure 5.
Comparison of OR gene clusters between mouse and African elephant. (A) A mouse cluster on chromosome 7 (Mm7.6) corresponded to nine elephant clusters, and (B) a mouse cluster on chromosome 9 (Mm9.3) corresponded to seven elephant clusters (see Supplemental Table S5). Each horizontal line represents a mouse chromosome (top) or a scaffold of the African elephant genome (bottom). The position of each OR gene is represented by a colored vertical bar above or below a horizontal line, the latter indicating the opposite transcriptional direction to the former. Long, medium, and short vertical bars depict an intact gene, a truncated gene, or a pseudogene, respectively. Each bar is colored according to the OGG to which the OR gene belongs; the color code chart is at the bottom of the figure. Class I OGGs are colored between red and yellow in the color chart in order of OGG numbers, while Class II OGGs are colored between yellow and red. When a mouse gene and an elephant gene belong to the same OGG, the two genes are connected by a gray line. The scaffold number for each elephant cluster is shown below the diagram; for example, “s79” indicates scaffold79. A scaffold with an asterisk (e.g., s277*) indicates that the respective scaffold is drawn in reverse orientation. A black vertical bar on a horizontal line is shown at intervals of 1 Mb. (A,B) The rightmost and the leftmost elephant scaffolds (s79 and s21 in A and s50 and s58 in B) contain one-end truncated clusters, while the others contain both-end truncated clusters. A dashed horizontal line indicates that DNA sequences are omitted. The entire length is drawn for a scaffold containing a both-end truncated cluster.
Figure 6.
Figure 6.
Changes in the number of OR genes during the evolution of placental mammals. Each number in a yellow box indicates the number of intact OR genes in an extant species. Each number in a cyan oval represents the number of functional OR genes in an ancestral node estimated by the reconciled-tree method (Niimura and Nei 2007). Estimated numbers of gene gains and gene losses in each branch are also shown. Black and orange bars to the right of a species name indicate the number of gene gains and that of gene losses, respectively, compared with the 781 ancestral OR genes that were present in the MRCA of placental mammals. For example, 462 out of the 781 OR genes in the MRCA were lost in the human lineage, but 77 gene gains also occurred and resulted in the current human repertoire of 396 intact OR genes. Note that the number of gene losses in a black bar is not equal to the sum of gene losses in the branches from the MRCA to a given species, because the number of gene losses at each branch includes that of gene losses that occurred after gene duplication. For the same reason, the number of gene gains in an orange bar is not the same as the total number of gene gains in the branches from the MRCA to the species considered. The divergence time at each node was obtained from TimeTree (http://www.timetree.org/) (see Supplemental Fig. S1; Hedges et al. 2006).

References

    1. Adipietro KA, Mainland JD, Matsunami H. 2012. Functional evolution of mammalian odorant receptors. PLoS Genet 8: e1002821. - PMC - PubMed
    1. Aloni R, Olender T, Lancet D. 2006. Ancient genomic architecture for mammalian olfactory receptor clusters. Genome Biol 7: R88. - PMC - PubMed
    1. Altschul SF, Madden TL, Schaffer AA, Zhang J, Zhang Z, Miller W, Lipman DJ. 1997. Gapped BLAST and PSI-BLAST: a new generation of protein database search programs. Nucleic Acids Res 25: 3389–3402 - PMC - PubMed
    1. Bates LA, Sayialel KN, Njiraini NW, Moss CJ, Poole JH, Byrne RW. 2007. Elephants classify human ethnic groups by odor and garment color. Curr Biol 17: 1938–1942 - PubMed
    1. Bates LA, Sayialel KN, Njiraini NW, Poole JH, Moss CJ, Byrne RW. 2008. African elephants have expectations about the locations of out-of-sight family members. Biol Lett 4: 34–36 - PMC - PubMed

Publication types

Substances