. 2014 Jul 23;9(7):e102119.
doi: 10.1371/journal.pone.0102119. eCollection 2014.

Mining TCGA data using Boolean implications

Affiliations

Mining TCGA data using Boolean implications

Subarna Sinha et al. PLoS One. .

Abstract

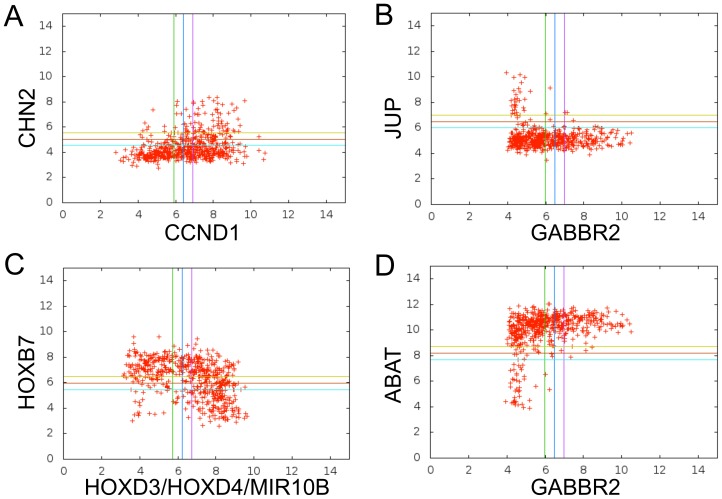
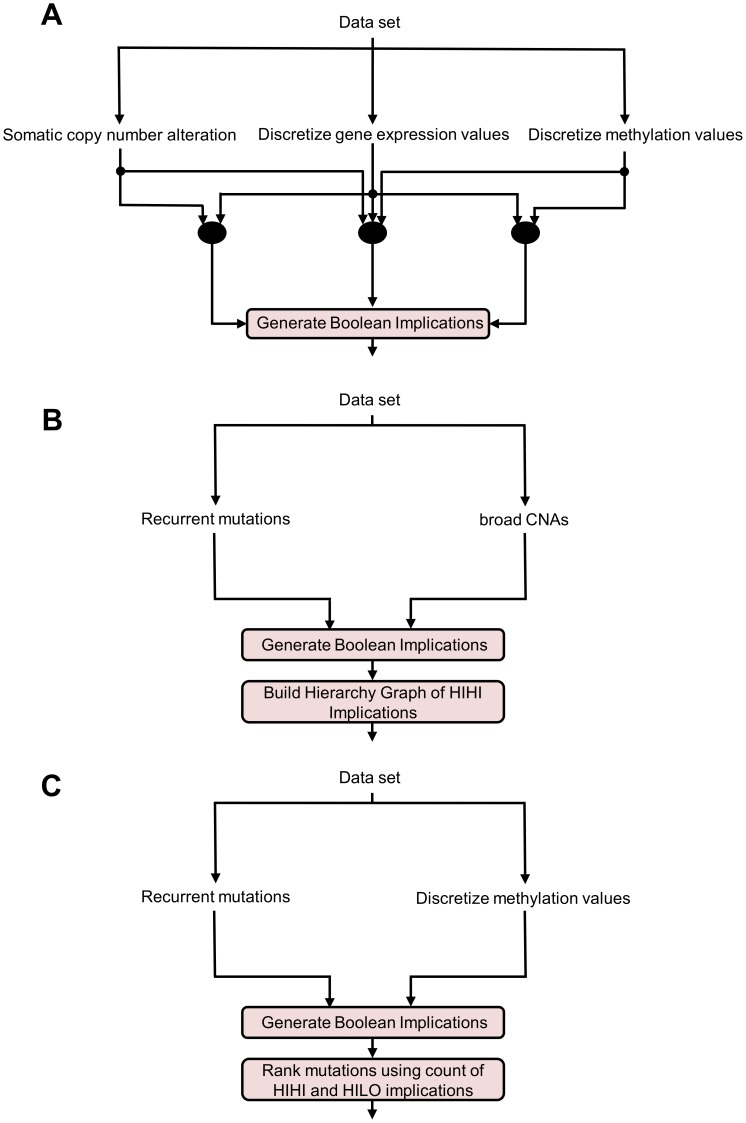
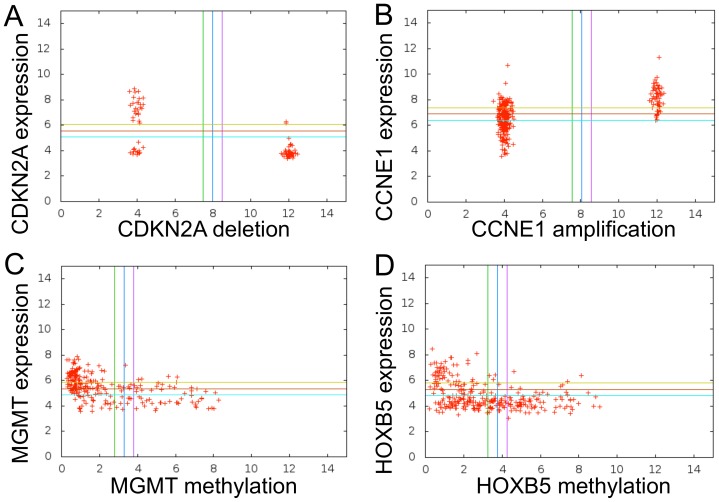
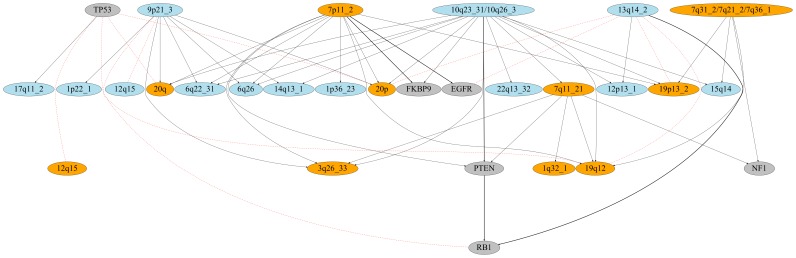
Boolean implications (if-then rules) provide a conceptually simple, uniform and highly scalable way to find associations between pairs of random variables. In this paper, we propose to use Boolean implications to find relationships between variables of different data types (mutation, copy number alteration, DNA methylation and gene expression) from the glioblastoma (GBM) and ovarian serous cystadenoma (OV) data sets from The Cancer Genome Atlas (TCGA). We find hundreds of thousands of Boolean implications from these data sets. A direct comparison of the relationships found by Boolean implications and those found by commonly used methods for mining associations show that existing methods would miss relationships found by Boolean implications. Furthermore, many relationships exposed by Boolean implications reflect important aspects of cancer biology. Examples of our findings include cis relationships between copy number alteration, DNA methylation and expression of genes, a new hierarchy of mutations and recurrent copy number alterations, loss-of-heterozygosity of well-known tumor suppressors, and the hypermethylation phenotype associated with IDH1 mutations in GBM. The Boolean implication results used in the paper can be accessed at http://crookneck.stanford.edu/microarray/TCGANetworks/.


Conflict of interest statement

Competing Interests: EKT received funding in the form of a Hewlett-Packard Stanford Graduate Fellowship. There are no patents, products in development, or marketed products to declare. This does not alter the authors' adherence to PLOS ONE policies on sharing data and materials.

Figures

Figure 1
Figure 1. Boolean Implications illustrated using data from gene expression arrays.
Each variable has a threshold, represented in the plot as a blue line, that divides the variable into “low” and “high” levels. The green and purple lines are −0.5 and +0.5 away from the threshold on the X axis, respectively. Samples that fell between the green and purple vertical lines on the X axis and between the yellow and blue horizontal lines on the Y axis were not considered during the generation of a Boolean implication. Each point in the scatterplot represents the values of two variables in a tumor sample. Four L-shaped relationships of gene expression are shown (left-to-right and top-to-bottom) (A) LOLO (if CCND1 is low, then CHN2 is low), (B) HILO (if GABBR2 is high, then JUP is low) (C) LOHI (if HOXB7 is low, then HOXD3 is high) (D) HIHI (if GABBR2 is high, then ABAT is high). A Boolean implication exists between two variables when one quadrant is very sparse. Boolean implications can capture L-shaped relationships as well as linear relationships (in which case the two opposite quadrants are sparse), revealing many associations not found by other methods.
Figure 2
Figure 2. Analysis Pipeline.
(A) Boolean implications are extracted between copy number alteration and expression of a gene, DNA methylation and expression of a gene, and Boolean implications combining all three variables: if (gene is deleted or gene is methylated), then gene expression is low. (B) Boolean implications extracted between mutations and recurrent copy number alterations represented as broad Copy Number Alterations (CNAs) are used to build a hierarchy graph. (C) Boolean implications extracted between mutations and methylation are used to predict the role of a mutation in producing aberrant methylation.
Figure 3
Figure 3. Boolean Implications Between Copy Number Alterations/DNA Methylation and Expression of the Same Gene.
Boolean implications between variables are easily verified by inspecting scatter plots. Data for deletions and amplifications were rescaled: a value of 12 implies gene deletion or amplification; a value of 4 implies no somatic copy number change for the gene. Gaussian noise was added so the points do not fall exactly on 4 and 12 to allow easier visualization. The beta-values of methylation (which is how TCGA reports methylation data) were scaled by a factor of 10. (A) HILO Boolean Implication between CDKN2A deletion and CDKN2A expression in TCGA GBM data set. (B) HIHI Boolean Implication between CCNE1 amplification and CCNE1 expression in TCGA OV data set. (B) HILO Boolean Implication between MGMT methylation and MGMT expression in TCGA GBM data set. (D) HILO Boolean Implication between HOXB5 methylation and HOXB5 expression in TCGA OV data set.
Figure 4
Figure 4. Boolean Implications between Genomic Alterations in GBM.
The nodes depicting amplifications, deletions and mutations are colored in orange, blue and grey, respectively. The HIHI implications are represented by black directed edges with the arrow pointing from the superset to the subset. The superset is always above the subset in the diagram. The HILO implications are depicted by red dashed undirected edges. The relationships capture a multitude of biologically interesting phenomena: temporal progression, hierarchical pathway hits, LOH for PTEN and RB1, and a subset relationship between EGFR mutations and 7p11_2 amplifications.

References

    1. Sahoo D, Dill D, Gentles A, Tibshirani R, Plevritis S (2008) Boolean implication networks derived from large scale, whole genome microarray data. Genome Biology 9: R157. - PMC - PubMed
    1. Sahoo D, Seita J, Bhattacharya D, Inlay M, Weissman I, et al. (2010) MiDReG: A method of mining developmentally regulated genes using boolean implications. Proceedings of the National Academy of Sciences 107(13): 5732–5737. - PMC - PubMed
    1. Dalerba P, Kalisky T, Sahoo D, Rajendran P, Rothenberg ME, et al. (2011) Single-cell dissection of transcriptional heterogeneity in human colon tumors. Nature Biotechnology 29(12): 1120–1127. - PMC - PubMed
    1. van Wieringen W, van de Wiel M (2009) Nonparametric testing for DNA copy number induced differential mrna gene expression. Biometrics 65: 19–29. - PubMed
    1. Salari K, Tibshirani R, Pollack J (2009) DR-Integrator: a new analytic tool for integrating DNA copy number and gene expression. Bioinformatics 26(3): 414–416. - PMC - PubMed

Publication types