

Identifying keystone species in the human gut microbiome from metagenomic timeseries using sparse linear regression
- PMID: 25054627
- PMCID: PMC4108331
- DOI: 10.1371/journal.pone.0102451
Identifying keystone species in the human gut microbiome from metagenomic timeseries using sparse linear regression
Abstract
Human associated microbial communities exert tremendous influence over human health and disease. With modern metagenomic sequencing methods it is now possible to follow the relative abundance of microbes in a community over time. These microbial communities exhibit rich ecological dynamics and an important goal of microbial ecology is to infer the ecological interactions between species directly from sequence data. Any algorithm for inferring ecological interactions must overcome three major obstacles: 1) a correlation between the abundances of two species does not imply that those species are interacting, 2) the sum constraint on the relative abundances obtained from metagenomic studies makes it difficult to infer the parameters in timeseries models, and 3) errors due to experimental uncertainty, or mis-assignment of sequencing reads into operational taxonomic units, bias inferences of species interactions due to a statistical problem called "errors-in-variables". Here we introduce an approach, Learning Interactions from MIcrobial Time Series (LIMITS), that overcomes these obstacles. LIMITS uses sparse linear regression with boostrap aggregation to infer a discrete-time Lotka-Volterra model for microbial dynamics. We tested LIMITS on synthetic data and showed that it could reliably infer the topology of the inter-species ecological interactions. We then used LIMITS to characterize the species interactions in the gut microbiomes of two individuals and found that the interaction networks varied significantly between individuals. Furthermore, we found that the interaction networks of the two individuals are dominated by distinct "keystone species", Bacteroides fragilis and Bacteroided stercosis, that have a disproportionate influence on the structure of the gut microbiome even though they are only found in moderate abundance. Based on our results, we hypothesize that the abundances of certain keystone species may be responsible for individuality in the human gut microbiome.
Conflict of interest statement
Figures
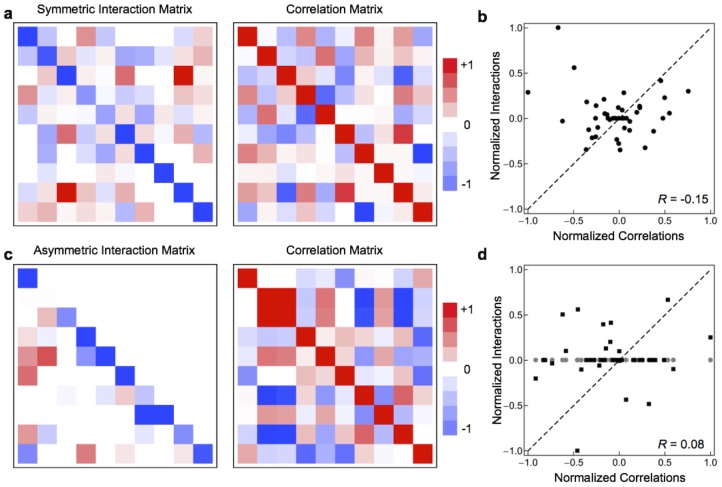
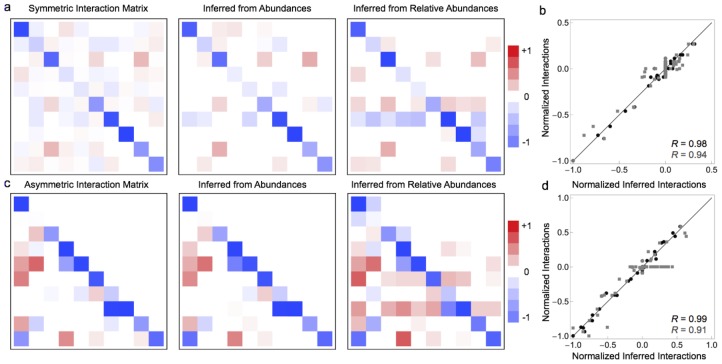
 , the largest positive element is
  , and all elements retain their sign. In b and d, interaction coefficents were scaled so that the largest element by absolute value has
  .
.

 one standard deviation, and lines connect the means.
 (poor performance) to
  (good performance). a) Specifity of sparse linear regression with Bagging as a function of measurement error for different prediction error thresholds. b) Specificity of sparse linear regression trained on the entire data set without Bagging as a function of measurement error for different prediction thresholds. c) Sensitivity of sparse linear regression with Bagging as a function of measurement error for different prediction error thresholds. d) Sensitivity of sparse linear regression trained on the entire data set without Bagging as a function of measurement error for different prediction error thresholds. Notice that without bagging, model performance is extremely sensitive to choice of the threshold for the required improvement in prediction for adding new interactions.
 . In individual b) species 5 Bacteroides stercosis acts as a keystone species with 4 outgoing interactions, compared a median number of outgoing interactions of
  . The 14 species included in the model were obtained by taking the union of the top 10 most abundant species from individuals a and b. The required improvement in prediction was set to 3%, graphs obtained using other prediction thresholds are shown in the Supporting Information.
References
Publication types
MeSH terms
Grants and funding
LinkOut - more resources
Full Text Sources
Other Literature Sources
