

Estimating species richness and modelling habitat preferences of tropical forest mammals from camera trap data
- PMID: 25054806
- PMCID: PMC4108438
- DOI: 10.1371/journal.pone.0103300
Estimating species richness and modelling habitat preferences of tropical forest mammals from camera trap data
Erratum in
- PLoS One. 2014;9(10):e110971
Abstract
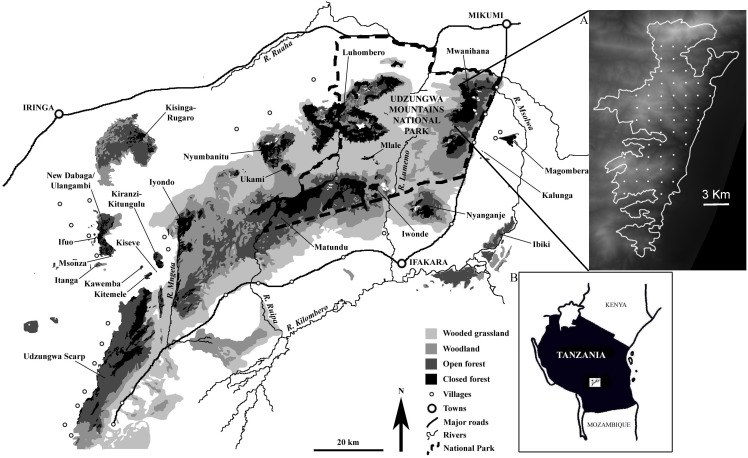
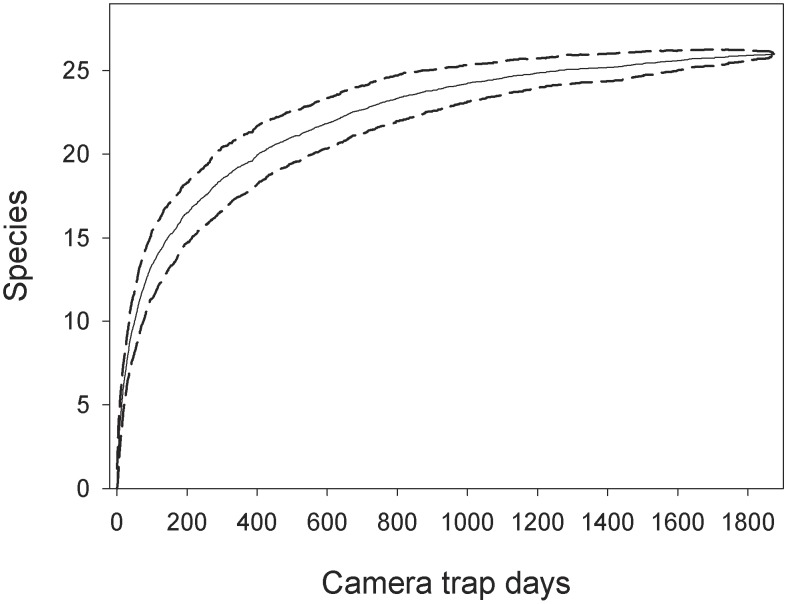
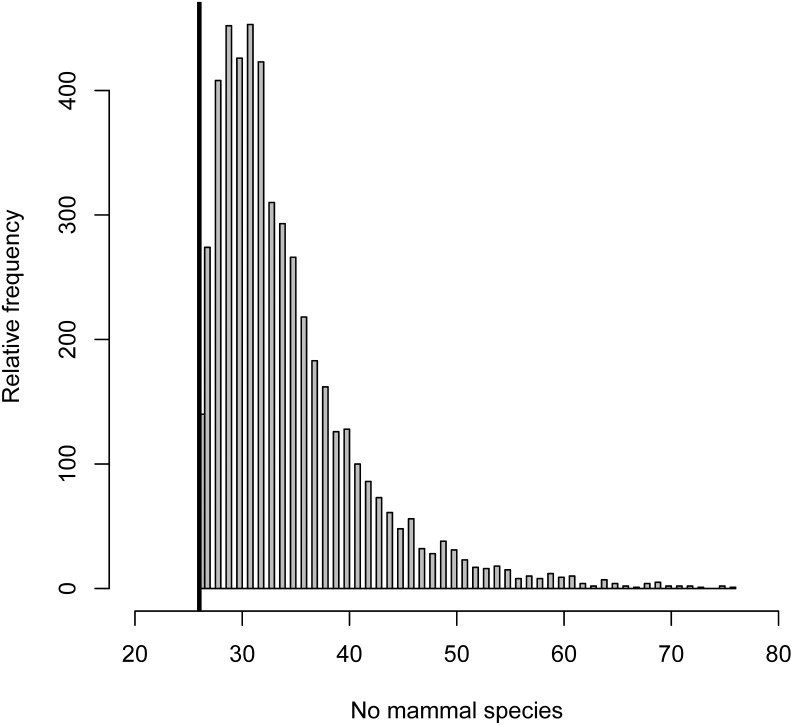
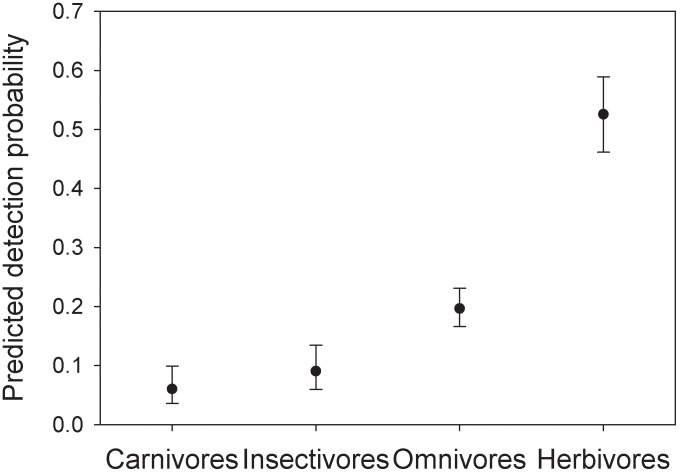
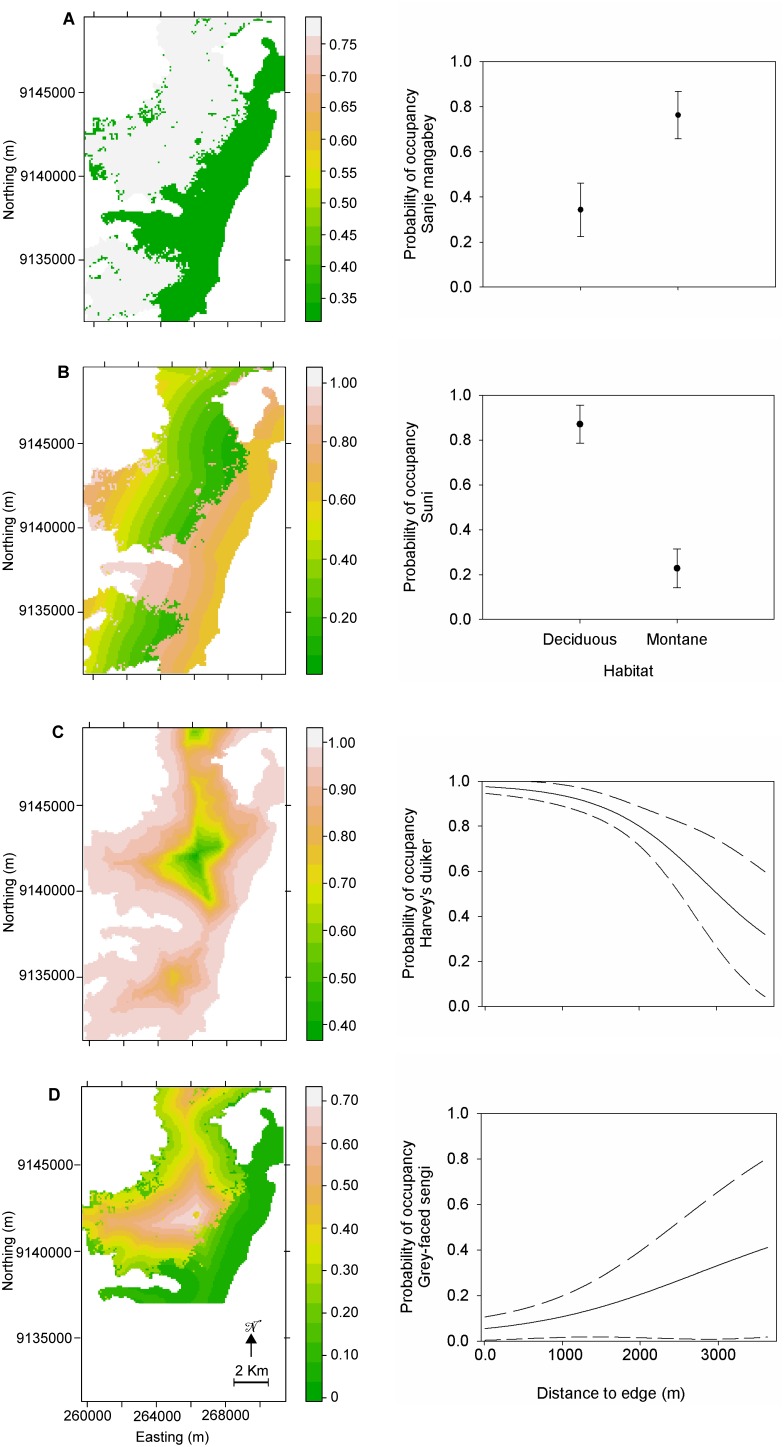
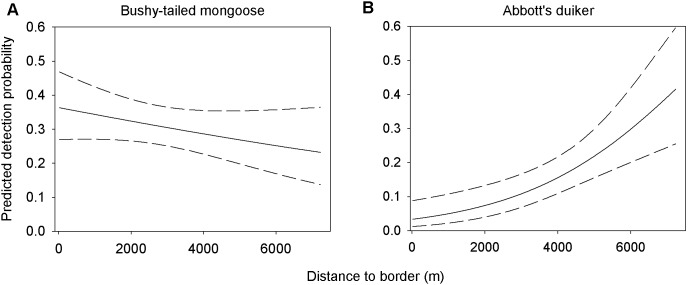
Medium-to-large mammals within tropical forests represent a rich and functionally diversified component of this biome; however, they continue to be threatened by hunting and habitat loss. Assessing these communities implies studying species' richness and composition, and determining a state variable of species abundance in order to infer changes in species distribution and habitat associations. The Tropical Ecology, Assessment and Monitoring (TEAM) network fills a chronic gap in standardized data collection by implementing a systematic monitoring framework of biodiversity, including mammal communities, across several sites. In this study, we used TEAM camera trap data collected in the Udzungwa Mountains of Tanzania, an area of exceptional importance for mammal diversity, to propose an example of a baseline assessment of species' occupancy. We used 60 camera trap locations and cumulated 1,818 camera days in 2009. Sampling yielded 10,647 images of 26 species of mammals. We estimated that a minimum of 32 species are in fact present, matching available knowledge from other sources. Estimated species richness at camera sites did not vary with a suite of habitat covariates derived from remote sensing, however the detection probability varied with functional guilds, with herbivores being more detectable than other guilds. Species-specific occupancy modelling revealed novel ecological knowledge for the 11 most detected species, highlighting patterns such as 'montane forest dwellers', e.g. the endemic Sanje mangabey (Cercocebus sanjei), and 'lowland forest dwellers', e.g. suni antelope (Neotragus moschatus). Our results show that the analysis of camera trap data with account for imperfect detection can provide a solid ecological assessment of mammal communities that can be systematically replicated across sites.
Conflict of interest statement
Figures
References
-
- O’Brien TG, Baillie JEM, Krueger L, Cuke M (2010) The Wildlife Picture Index: monitoring top trophic levels. Anim Conserv 13: 335–343.
-
- Hoffmann M, Hilton-Taylor C, Angulo A, Böhm M, Brooks TM, et al. (2010) The impact of conservation on the status of the world’s vertebrates. Science 330: 1503–1509. - PubMed
-
- Ceballos G, Ehrlich P, Soberon J, Salazar I, Fay J (2005) Global mammal conservation: what must we manage? Science 309: 603–607. - PubMed
Publication types
MeSH terms
LinkOut - more resources
Full Text Sources
Other Literature Sources
Miscellaneous
