. 2014 Aug;42(14):8873-83.
doi: 10.1093/nar/gku641. Epub 2014 Jul 23.

The structural code of cyanobacterial genomes

Affiliations

The structural code of cyanobacterial genomes

Robert Lehmann et al. Nucleic Acids Res. 2014 Aug.

Abstract

A periodic bias in nucleotide frequency with a period of about 11 bp is characteristic for bacterial genomes. This signal is commonly interpreted to relate to the helical pitch of negatively supercoiled DNA. Functions in supercoiling-dependent RNA transcription or as a 'structural code' for DNA packaging have been suggested. Cyanobacterial genomes showed especially strong periodic signals and, on the other hand, DNA supercoiling and supercoiling-dependent transcription are highly dynamic and underlie circadian rhythms of these phototrophic bacteria. Focusing on this phylum and dinucleotides, we find that a minimal motif of AT-tracts (AT2) yields the strongest signal. Strong genome-wide periodicity is ancestral to a clade of unicellular and polyploid species but lost upon morphological transitions into two baeocyte-forming and a symbiotic species. The signal is intermediate in heterocystous species and weak in monoploid picocyanobacteria. A pronounced 'structural code' may support efficient nucleoid condensation and segregation in polyploid cells. The major source of the AT2 signal are protein-coding regions, where it is encoded preferentially in the first and third codon positions. The signal shows only few relations to supercoiling-dependent and diurnal RNA transcription in Synechocystis sp. PCC 6803. Strong and specific signals in two distinct transposons suggest roles in transposase transcription and transpososome formation.


Figures

Figure 1.
Figure 1.
Approximately 11 bp dinucleotide periodicity in cyanobacterial genomes. (A) An ad hoc hypothesis tree on plausible interpretations of the ∼11 bp period in bacterial genomes, as discussed in the Introduction. Positive and negative evidence presented herein are indicated. (B) Autocorrelation function (ACF) of motif AT2 positions in the chromosome of Synechocystis sp. PCC 6803 before (CNNNN(k), gray) and after smoothing by a window of 3 bp (formula image, black). (C) Power spectrum formula image of the interval k = [30, 101] bp (indicated in the left panel) of the smoothed ACF and evaluated at periods T = [2, 15] bp. The dashed vertical line (right panel) indicates the maximum at 11.4 bp.
Figure 2.
Figure 2.
Periodic dinucleotides across the cyanobacterial clade. (A) The power spectrum signal-to-noise ratio formula image for periods 10–12 bp (color-coded) for all possible dinucleotides NN, WW and the AT-tract motif AT2 (columns) and for genomes of 54 cyanobacterial and 4 ‘control’ species (rows). Hierarchical linkage clustering was performed using Ward's method for species (tree on the left) and ‘complete linkage’ for dinucleotides, and cut at level k = 4 to obtain clusters A–D. (B) The phylogenetic tree was obtained from the authors of (40) and is based on alignments of 31 conserved proteins. The colored clades were bootstrap-supported at ≥70%. The columns on the right show (in order): the clustering of species and their formula image from Figure 2A; the morphological sections (I–IV); whether they are able to fix nitrogen; and the genome length in Mbp (without plasmids). Ancestral states (cluster assignments and color-coded formula image at internal nodes) were inferred using maximum-likelihood methods (Supporting Methods). All species data are provided in Supporting File S1.
Figure 3.
Figure 3.
AT2 periodicity and the protein code. (A) The overlap of periodic genome segments with coding sequences (CDS) and with intergenic regions was investigated by Jaccard tests (51). Genome segments were concatenated from adjacent significantly periodic windows of 200 bp length in four period ranges (columns). Species name colors indicate their formula image as in Figure 2. (B) The formula image of codon-permuted and concatenated protein-coding regions (CDS) of Oscillatoria nigro-viridis PCC 7112 for the original coding sequences (CDS), and the mean spectra of 50 permutations: codon order permutation (Ord.), synonymous codon replacement (Syn.) and permutations of only the first (Pos. I), second (Pos. II) or third (Pos. III) codon positions. (C) The fraction Q′(T) of the unpermuted signal at T = 11.8 bp (vertical line in B) remaining after permutations (open circles are the means and vertical lines indicates the range of sampled values in 50 permutations). (D) As Figure 3C but summarized for the species clusters from Figure 2A (without non-cyanobacteria), where ‘Dformula image’ is without the four species in ‘D/loss’ (solid lines indicate the standard deviation, dashed lines the full range) and for E. coli str. K–12 substr. MG1655. The full spectra of representative species for all 58 species are shown in Supplementary Figures S2–S6.
Figure 4.
Figure 4.
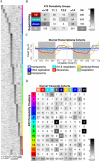
Periodicity in PCC 6803 coding regions. (A) 1000 coding sequences of Synechocystis sp. PCC 6803, clustered by their AT2 periodicity spectra formula image (color-coded, with black indicating higher values). The period T (in bp) is shown on the x-axis for all coding sequences i on the y-axis. The cluster membership (1–14 from top to bottom) of coding sequences is shown color-coded on the right. (B) Cluster overlap profile. CDS periodicity clusters were comprehended into groups with similar main period Tmax (columns, see table in Supplementary Figure S10A) and analyzed for overlaps with genes ‘up’-regulated, ‘down’-regulated and genes that showed a ‘mixed’ or no (nr) response to experimentally manipulated levels of DNA superpcoiling (rows, from (49)). The numbers are the genes shared by the respective clusters and the color code indicates the P-values derived from cumulative hypergeometric distribution tests for enrichment and without correction for multiple testing to show unbiased and comparable overlap profiles. (C) Mean transcript abundance time-series of diurnally co-transcribed cohorts. Only cohorts that also show typical features of supercoiling-sensitivity (function, strong bias in GC-content, Supplementary Figures S11 and S12), are shown. (D) Cluster overlap profile of diurnally co-transcribed ((46), Supplementary Figure S11) gene cohorts (columns) with the CDS periodicity clusters (rows). All transcriptome-based and the CDS periodicity clusters are provided in Supporting File S2.
Figure 5.
Figure 5.
Transposons curvature. The DNA curvature paths of the ISY100f (slr0230) transposon of Synechocystis sp. PCC 6803 (top, 951 bp) and the PCC8801_2977 tranposase ORF of Cyanothece sp. PCC 8801 (bottom, 1227 bp) were predicted with the webserver model.it (66) using the parameter set from (52) and visualized in VMD (67). Single nucleotides of the coding strand are shown as ‘beads’, the 5′ end is on the left. For ISY100f the inverted terminal repeats are included (68) and shown in red, the annotated Pfam domains PF01710 (ISY100f, amino acids 1–111) and PF01610 (PCC8801_2977, amino acids 157–255) are shown in blue and the remaining ORF in yellow.

References

    1. Trifonov E., Sussman J. The pitch of chromatin DNA is reflected in its nucleotide sequence. Proc. Natl. Acad. Sci. U.S.A. 1980;77:3816–3820. - PMC - PubMed
    1. Satchwell S., Drew H., Travers A. Sequence periodicities in chicken nucleosome core DNA. J. Mol. Biol. 1986;191:659–675. - PubMed
    1. Brogaard K., Xi L., Wang J., Widom J. A map of nucleosome positions in yeast at base-pair resolution. Nature. 2012;486:496–501. - PMC - PubMed
    1. Nalabothula N., Xi L., Bhattacharyya S., Widom J., Wang J., Reeve J., Santangelo T., Fondufe-Mittendorf Y. Archaeal nucleosome positioning in vivo and in vitro is directed by primary sequence motifs. BMC Genomics. 2013;14:391. - PMC - PubMed
    1. Herzel H., Weiss O., Trifonov E. 10-11 bp periodicities in complete genomes reflect protein structure and DNA folding. Bioinformatics. 1999;15:187–193. - PubMed

Publication types

MeSH terms