. 2014 Aug;42(14):9424-35.
doi: 10.1093/nar/gku656. Epub 2014 Jul 23.

5' isomiR variation is of functional and evolutionary importance

Affiliations

5' isomiR variation is of functional and evolutionary importance

Geok Chin Tan et al. Nucleic Acids Res. 2014 Aug.

Abstract

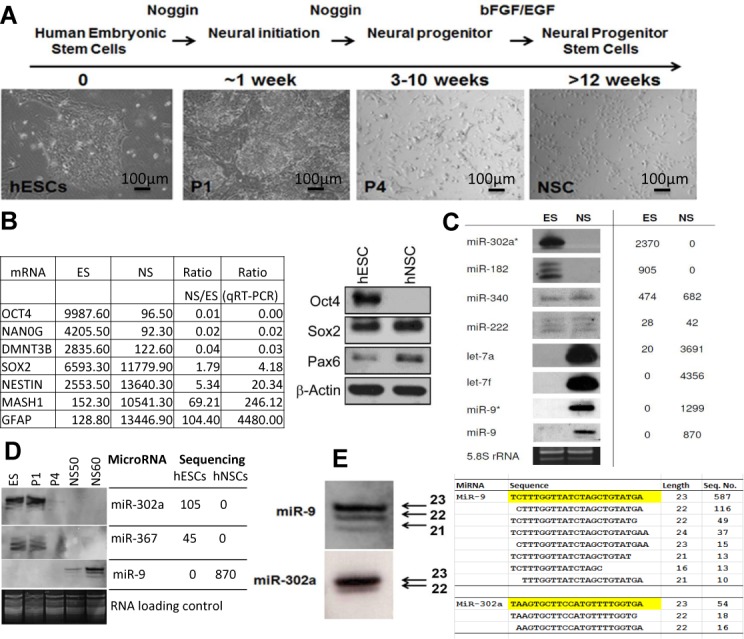
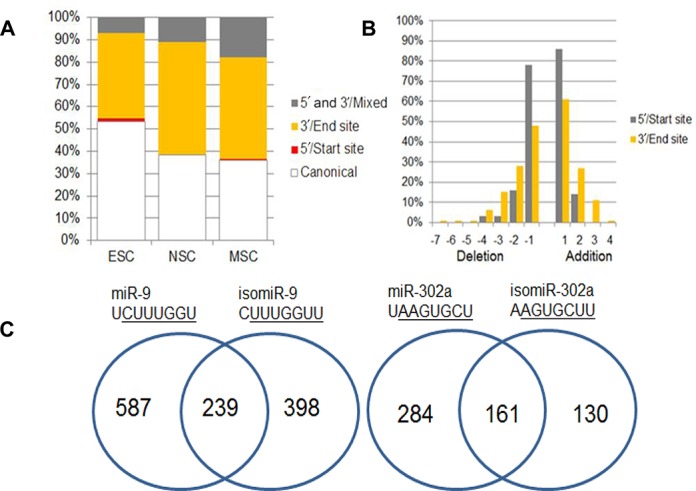
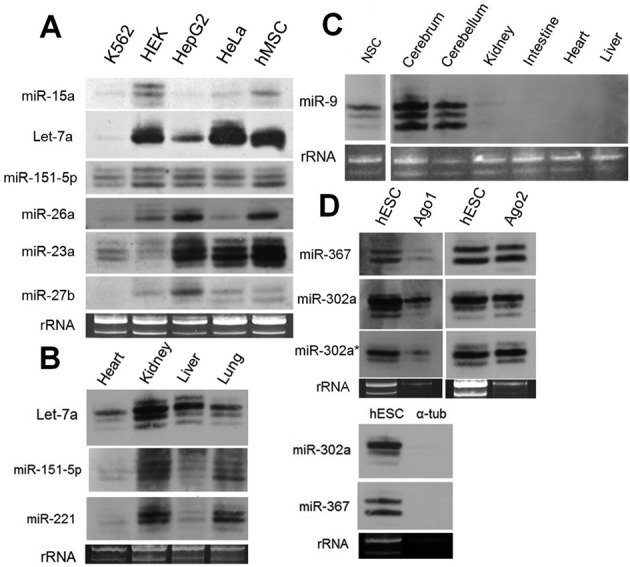
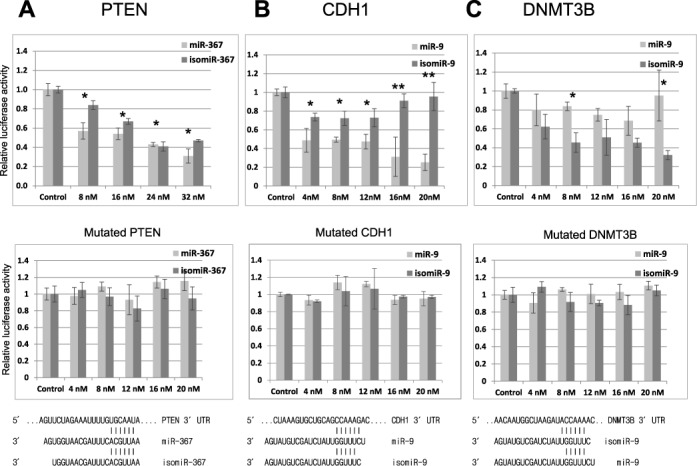
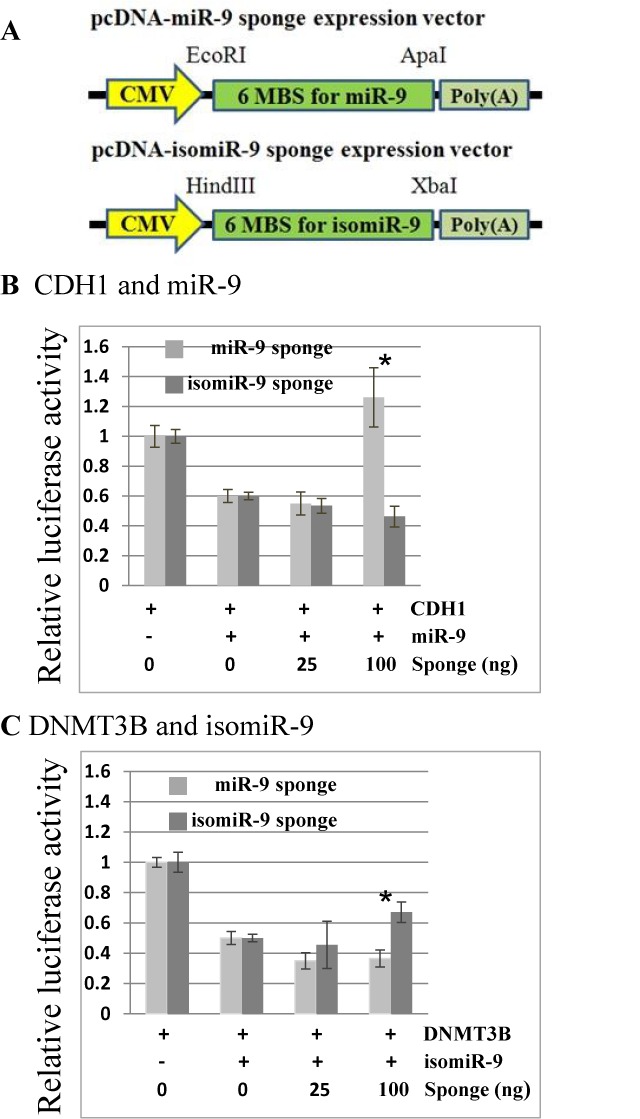
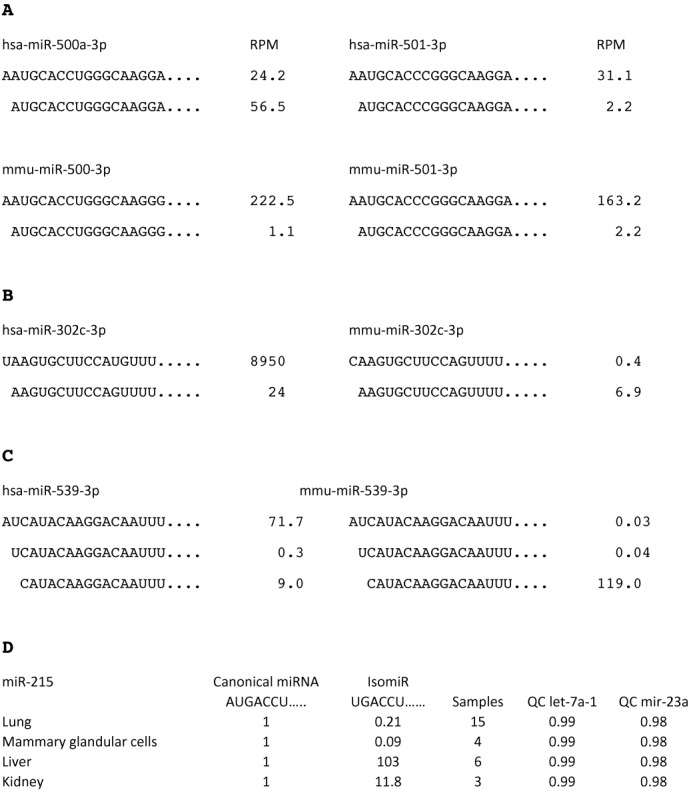
We have sequenced miRNA libraries from human embryonic, neural and foetal mesenchymal stem cells. We report that the majority of miRNA genes encode mature isomers that vary in size by one or more bases at the 3' and/or 5' end of the miRNA. Northern blotting for individual miRNAs showed that the proportions of isomiRs expressed by a single miRNA gene often differ between cell and tissue types. IsomiRs were readily co-immunoprecipitated with Argonaute proteins in vivo and were active in luciferase assays, indicating that they are functional. Bioinformatics analysis predicts substantial differences in targeting between miRNAs with minor 5' differences and in support of this we report that a 5' isomiR-9-1 gained the ability to inhibit the expression of DNMT3B and NCAM2 but lost the ability to inhibit CDH1 in vitro. This result was confirmed by the use of isomiR-specific sponges. Our analysis of the miRGator database indicates that a small percentage of human miRNA genes express isomiRs as the dominant transcript in certain cell types and analysis of miRBase shows that 5' isomiRs have replaced canonical miRNAs many times during evolution. This strongly indicates that isomiRs are of functional importance and have contributed to the evolution of miRNA genes.


Figures

Figure 1.
Figure 1.
Changes in mRNA and microRNA expression during neural differentiation from hESCs. (A) Morphological features during neural differentiation. (B) Microarray analysis of ES and NS expression of pluripotent and neural markers and confirmation by qRT-PCR and western blotting. (C and D) Northern blotting and sequencing result comparison of the indicated miRNAs during differentiation. (E) Detailed comparison of northern and sequencing results for isomiRs of miR-9 (NSCs) and miR-302a (ESCs). hESCs were differentiated to NSCs according to (26) and cells were collected at four different stages of differention, i.e. hESCs (P0), a week after neural induction (P1), 4 weeks after neural induction (P4) and NSC at passages 40, 50 (NS50) and 60 (NS60). Total RNAs from hESCs (PO) and NSCs (passage 40) were prepared for miRNA sequencing and microarray analysis. These samples and other NSC passages were also analysed by northern blotting, qRT-PCR and western blotting. ESC, embryonic stem cells; NSC, neuronal stem cells.
Figure 2.
Figure 2.
The distribution of 5′ and 3′ isomiRs in hESCs, NSCs and MSCs. (A) A bar graph illustrating the percentage of isomiRs with 5′or 3′ changes compared to the dominant miRNA for ESC, NSC and MSC miRNA libraries. (B) Additions and deletions at the 5′ and 3′ ends for ESC, NSC and MSC miRNAs combined and expressed as a percentage. (C) Venn diagrams comparing the predicted targets of mir-9–1 and the most common 5′ isomiR-9 and similarly for miR-302a. Predictions were made by TargetScanHuman (canonical) and TargetScan custom (isomiRs).
Figure 3.
Figure 3.
Northern blot analysis of isomiRs in human cell lines and mouse tissues. (A) Human cell lines, (B and C) mouse tissues, (D) human ESC cells before and after immunoprecipitation of Ago1 and Ago2. α-tub, anti-alpha tubulin (negative control). A total of 20 ug of total RNA was loaded per lane. Loading controls were stained with ethidium bromide.
Figure 4.
Figure 4.
5′ and 3′ isomiR analysis in luciferase assays. (A) Top panel: the 3′UTR of PTEN was cloned into the luciferase vector pGL3 (Promega) and its relative luciferase acitivity is plotted following its transfection (400 ng) into HEK293 cells with the indicated concentrations of miR-367 and a 3′ isomiR. Middle panel: repeat luciferase assay following mutation of the predicted seed target site for miR-367 within the 3′UTR of PTEN. Bottom panel: illustration of the sequences and expected alignment of miR-367 and isomiR-367 against the 3′UTR of PTEN. (B and C) Top panel: identical analyses of cloned regions of the 3′UTR of CDH1, which has a predicted target site for miR-9 and for DNMTB3, which has a predicted target site for a 5′isomiR of miR-9. Middle panels: repeat luciferase assays following mutation of the predicted seed target sites within the 3′UTRs. Bottom panel: illustration of the sequences and expected alignments of miR-9 and 5′isomiR-9 against the 3′UTRs of CDH1 and DNMT3B. The 3′UTRs regions that were chosen and the seed target site mutations are described in Supplementary Table S4. Error bars represent the standard deviation obtained from three independent experiments, * and ** represent statistical significance at the levels of P < 0.05 and P < 0.0001, respectively. Renilla luciferase was used as internal control to standardize against all firefly luciferase activities. n = 3. Note for top panels B and C the statistical difference is between single columns for miR-9 and isomiR-9, whereas for A the statistical difference is between the treatments and the control column pairs.
Figure 5.
Figure 5.
Sponge inhibitors of miR-9 and isomiR-9. (A) Outline of sponge constructs pcDNA-miR-9 amd pcDNA-isomiR-9 (see Materials and Methods). HEK293 cells were transfected with the indicated concentrations of each sponge vector with either (B) pGL3-CDH1–3′UTR (400 ng) and miR-9 (12 nM) or (C) pGL3-DNMT3B-3′UTR (400 ng) and isomiR-9 (12 nM). All results were normalized by renilla luciferase. For sponge sequences see Supplementary Table S4. Error bars represent the standard deviation obtained from three independent experiments, * represents statistical significance (between sponges) at P < 0.05.
Figure 6.
Figure 6.
IsomiR switching. (A) An example of 5′isomiR switching for hsa-mir-500a-3p. An isomiR of hsa-mir-501 (which is a paralogue of hsa-miR-500) and the mouse gene orthologues mmu-mir-500 and 501 (AUGCACCC…..) is expressed as a canonical miRNA by hsa-mir-500a. Only the most highly sequenced isomiR and miRNA (lead strands) are shown for these genes, there are less common isomiRs for these genes that are not shown. RPM is sequencing reads per million in total. The mir-500 family of miRNA genes are found only in mammals and in addition to Homo sapiens, the miR-500 genes of Gorilla gorilla, Sus scrofi and Canis familiaris also express AUGCACCU…. as the canonical miRNA. The remaining mammals for which there is sequencing data (Mus musculus and Rattus norvegicus) express AAUGCACCA …. as the canonical miRNA and AUGCACCA as an isomiR. For all other members of the human miR-500 family (miR-500b, 501 and 502) AUGCACCU is expressed as an isomiR and AAUGCACCA … as the canonical miRNA. (B) 5′isomiR to miRNA switch for mmu-mir-302c-3p. The miRNA AAGUGCUU….. is expressed as a canonical miRNA by mmu-miR-302c but as an isomiR by hsa-miR-302c and all of the remaining members of the miR-302 family of man and mouse. (C) An isomiR of hsa-mir-539 (CAUACAA….) is expressed as a canonical miRNA by mmu-mir-539 and by contrast an isomiR of mmu-mir-539 (AUCAUACAA….) is expressed as the canonical miRNA by hsa-mir-539. All data are taken from miRBase release 19, (30) and confirmed in miRGator v.3.0 for human sequences. In particular, miRGator confirmed that the dominant transcript of hsa-mir-500a has a 5′ sequence AUGCACCC….. in most cell types (29). (D) Table showing that hsa-mir-215 encodes an isomiR (UGACCU) that is the dominant transcript in the liver and kidney. The miR-215 canoncial sequence (miRBase, (30)) is assigned a value of 1 for each tissue type and the isomiR value equals the total number of isomiR sequence reads/total number of canonical sequencing reads for each tissue. Data compiled from 15, 4, 6 and 3 sequencing reads from lung, mammary glandular cells, liver and kidney currently deposited in miRGator v3.0 (29). The last two columns QC let-7a-1 and QC miR-23a are quality controls of the sequencing data. We analysed the invariant miRNAs let-7a-1 by dividing the total number of sequencing reads for the canonical miRNA by the total number of sequencing reads. We similarly analysed has-miR-23a. This method can identify samples that suffer from incomplete sequencing reads, see Supplementary Table S5 for further details.

References

    1. Hamilton A.J., Baulcombe D.C. A species of small antisense RNA in posttranscriptional gene silencing in plants. Science. 1999;286:950–952. - PubMed
    1. Lee L.W., Zhang S., Etheridge A., Ma L., Martin D., Galas D., Wang K. Complexity of the microRNA repertoire revealed by next-generation sequencing. RNA. 2010;16:2170–2180. - PMC - PubMed
    1. Griffiths-Jones S., Saini H.K., van Dongen S., Enright A.J. miRBase: tools for microRNA genomics. Nucleic Acids Res. 2008;36:D154–D158. - PMC - PubMed
    1. Kim V.N. MicroRNA biogenesis: coordinated cropping and dicing. Nat. Rev. Mol. Cell. Biol. 2005;6:376–385. - PubMed
    1. Ghildiyal M., Zamore P.D. Small silencing RNAs: an expanding universe. Nat. Rev. Genet. 2009;10:94–108. - PMC - PubMed

Publication types