. 2014 Sep 15;25(18):2695-709.
doi: 10.1091/mbc.E14-01-0007. Epub 2014 Jul 23.

Molecular dissection of the mechanism by which EWS/FLI expression compromises actin cytoskeletal integrity and cell adhesion in Ewing sarcoma

Affiliations

Molecular dissection of the mechanism by which EWS/FLI expression compromises actin cytoskeletal integrity and cell adhesion in Ewing sarcoma

Aashi Chaturvedi et al. Mol Biol Cell. .

Abstract

Ewing sarcoma is the second-most-common bone cancer in children. Driven by an oncogenic chromosomal translocation that results in the expression of an aberrant transcription factor, EWS/FLI, the disease is typically aggressive and micrometastatic upon presentation. Silencing of EWS/FLI in patient-derived tumor cells results in the altered expression of hundreds to thousands of genes and is accompanied by dramatic morphological changes in cytoarchitecture and adhesion. Genes encoding focal adhesion, extracellular matrix, and actin regulatory proteins are dominant targets of EWS/FLI-mediated transcriptional repression. Reexpression of genes encoding just two of these proteins, zyxin and α5 integrin, is sufficient to restore cell adhesion and actin cytoskeletal integrity comparable to what is observed when the EWS/FLI oncogene expression is compromised. Using an orthotopic xenograft model, we show that EWS/FLI-induced repression of α5 integrin and zyxin expression promotes tumor progression by supporting anchorage-independent cell growth. This selective advantage is paired with a tradeoff in which metastatic lung colonization is compromised.


Figures

FIGURE 1:
FIGURE 1:
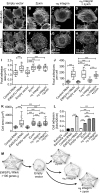
EWS/FLI-dependent changes in the actin cytoskeleton and contributions of cytoskeletal regulators. (A) Widefield fluorescence images of A673 Ewing sarcoma cells stained with phalloidin to visualize the actin filament network. A673 cells with EWS/FLI RNAi had robust actin cytoskeletons and were more spread than A673 cells with control RNAi. Scale bar, 20 μm. (B) Western immunoblot of parent Ewing sarcoma A673 cells (lane 1), A673 cells with control RNAi (lane 2), or EWS/FLI RNAi (lane 3) were probed with antibodies for FLI-1, zyxin, α5 integrin, and tubulin (loading control). EWS/FLI knockdown resulted in increased zyxin and α5 integrin protein. (C) Western immunoblot of Ewing sarcoma cells engineered to express empty vector, zyxin, α5 integrin, or both α5 integrin and zyxin were probed with antibodies for FLI-1, zyxin, α5 integrin, and tubulin (loading control). Independent expression of zyxin or α5 integrin above the endogenous levels in A673 cells did not affect the level of the other protein. (D–G) Widefield fluorescence images of phalloidin-stained A673 cells engineered to express empty vector (D), zyxin (E), α5 integrin (F), or both α5 integrin and zyxin (G) suggest increased actin cytoskeleton and cell spreading in cells that reexpress these proteins.
FIGURE 2:
FIGURE 2:
Zyxin and α5 integrin contribute to the actin cytoskeleton, focal adhesions, cell spreading, and cell adhesion in Ewing sarcoma cells. (A–H) A673 cells engineered to express empty vector (A, E), zyxin (B, F), α5 integrin (C, G), or both α5 integrin and zyxin (D, H) were stained for actin filaments (phalloidin, A–D) and focal adhesions (paxillin, E–H), followed by immunofluorescence microscopy. Control A673 cells were small and round, with minimal actin stress fibers and few focal adhesions. Cells that express zyxin, α5 integrin, or both α5 integrin and zyxin were well spread, with prominent focal adhesions. Focal adhesion size (I) and number per cell (J) were quantitated for at least 25 cells (each condition) and compared between control and EWS/FLI RNAi cells and cells that express zyxin, α5 integrin, or both α5 integrin and zyxin. (K) Total cell area was measured in at least 35 phalloidin-stained cells with either RNAi (control and EWS/FLI) or with expression of zyxin, α5 integrin, or both α5 integrin plus zyxin. Cell spreading and area increased with EWS/FLI knockdown and with expression of zyxin and α5 integrin. (L) Cell adhesion was evaluated by plating cells for 2 h, followed by colorimetric detection. Data are graphed as mean with SEM (six wells each cell type). Cells with control RNAi or empty vector adhered less than cells with EWS/FLI RNAi or cells that express zyxin, α5 integrin, or both α5 integrin and zyxin. (M) Model of Ewing sarcoma cell phenotypes. The actin cytoskeleton and focal adhesions, cell spreading, and cell area are changed by these proteins in unique and distinct ways. EWS/FLI expression compromises Ewing sarcoma cell adhesion by influencing actin cytoskeleton, cell morphology, and spreading, perhaps due to the down-regulation of cell adhesion proteins in general and of zyxin and α5 integrin in particular. For I–K, data are graphed as box-and-whisker plot (median with 25% quartile above and below in the box, and whiskers as minimum to maximum), with the individual data points included as scatter plot. Bars identify the data sets compared in parametric unpaired t tests. ***p < 0.001; other comparisons were not statistically different.
FIGURE 3:
FIGURE 3:
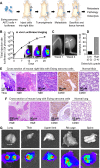
Intratibial orthotopic mouse model for Ewing sarcoma recapitulates features of the human disease. (A) Schematic diagram of the orthotopic mouse model, in which A673 Ewing sarcoma cells engineered to express luciferase were injected into the tibia, then monitored weekly for 4 wk for tumor growth, osteolysis, and metastasis, followed by ex vivo analysis and histopathology. (B) Tibial tumor growth and proliferation of Ewing sarcoma cells were measured by in vivo luciferase bioluminescence imaging. Data are graphed as mean with SEM, n = 5 mice. (C) Osteolysis (white arrows indicate regions of bone loss) increased compared with the same mouse tibia at week 1. (D) Qualitative analysis of mouse radiographs by an independent analyst revealed ∼85% of mice had high-grade osteolysis (grade 3 or 4) in the injected tibias. (E) Histopathological analysis of tibial tumors showed highly invasive tumor in the tibia (1, 5×) and closer examination (2, 20×; and 3, 400×) revealed the presence of typical small, round, blue Ewing sarcoma cells. Membranous staining for Ewing sarcoma marker CD99 (brown staining in 4) confirmed Ewing sarcoma cells in the tibial tumor, and CD99 staining was negative in a normal tibia (5). (F) Mouse lung with metastatic lesions sectioned and stained by H&E (1, 2) also contained small, round, blue cells typical of Ewing sarcoma, and the lung was positive for Ewing sarcoma marker CD99 (brown staining in 3) and negative for CD99 in a normal lung (4). (G) Representative ex vivo luciferase imaging to evaluate metastasis in lungs and bones at harvest.
FIGURE 4:
FIGURE 4:
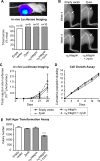
Zyxin and α5 integrin coexpression in Ewing sarcoma cells reduce tumor growth, whereas osteolytic degradation of bone persists. (A) In vivo luciferase imaging of mice 4 wk after intratibial injections with Ewing sarcoma A673 cells engineered to express empty vector, zyxin, α5 integrin, or both α5 integrin and zyxin. Every cell type was capable of inducing tibial tumors detectable by bioluminescence imaging. (B) Radiographs of tibias 4 wk after injections with cells that express empty vector, zyxin, α5 integrin, or both α5 integrin and zyxin revealed high-grade osteolysis (white arrows) regardless of which cell type was injected. (C) In vivo luciferase imaging of tibial tumors for 4 wk. Bioluminescence signals restricted to the tibial tumor region were quantitated (photons/second) and graphed over time as mean with SEM. *p < 0.05 for unpaired t test between empty vector group (n = 15 mice) and α5 integrin plus zyxin group (n = 10 mice). Expression of α5 integrin plus zyxin in Ewing sarcoma cells inhibited the tumor growth compared with the other groups. (D) 3T5 cell growth assay of A673 Ewing sarcoma cells with empty vector, zyxin, α5 integrin, or both α5 integrin and zyxin did not detect a difference in growth and proliferation in culture. Data from a single experiment are shown, representative of three sets of cell growth assays. (E) Soft-agar transformation and colony formation of cells with empty vector, zyxin, or α5 integrin alone were not different. However, colony formation in soft agar was inhibited in A673 cells that expressed both α5 integrin and zyxin. Graph is shown as mean with SEM, and ***p <0.001 in unpaired Student's t test between empty vector and α5 integrin plus zyxin data sets.
FIGURE 5:
FIGURE 5:
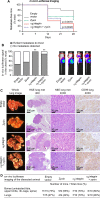
Ewing sarcoma cells that express zyxin and α5 integrin metastasize to lungs and bones. (A) Metastasis-free survival curve of mice evaluated by in vivo luciferase imaging of the four cell-type groups at weekly intervals. Metastasis was defined as appearance of bioluminescence signal other than at injection site, primarily the chest area. In unpaired t tests between the empty vector group and the α5 integrin group, p = 0.0018, and between the empty vector group and the α5 integrin plus zyxin group, p = 0.0028. (B) Week 4 endpoint images of in vivo luciferase signal were examined for metastasis. Almost all mice injected with Ewing sarcoma cells that expressed α5 integrin, either alone or in combination with zyxin, had significant metastasis by in vivo imaging, whereas only half the mice injected with empty vector control cells or with zyxin-expressing cells had in vivo chest signal at 4 wk. Dissection of the mice revealed the chest signals were due to heavy involvement of lungs. **p < 0.01 in unpaired Student's t tests between empty vector group and α5 integrin alone or α5 integrin plus zyxin group. (C) Lungs exhibited macroscopically visible lesions (1) that were obvious in every mouse. Paraffin-embedded lungs were sectioned, and H&E staining identified multiple metastases characterized by the presence of small, round, blue cells (2, 3). Immunohistochemistry for the Ewing sarcoma marker CD99 on lung sections (4, brown signal) confirmed the presence of Ewing sarcoma cells. (D) Immediately after dissection, ex vivo luciferase signals of multiple organs and skeletal regions were examined for each mouse. The number of mice positive for luciferase signal in bones, lungs, or other organs was scored, and results are presented as percentage of mice in each group. For all groups of mice, the preferred metastatic sites were bones and lungs.
FIGURE 6:
FIGURE 6:
Ewing sarcoma cells that express zyxin and α5 integrin exhibit increased adhesion to lung parenchyma. In vivo lung adhesion assay of Ewing sarcoma cells that express empty vector (labeled red, DiI) and cells that express zyxin, α5 integrin, or both α5 integrin and zyxin (labeled green, DiO). Red and green cells were combined 1:1, and 1 million cells were injected into the tail veins of three mice and given 24 h to circulate and adhere. At 24 h, lungs were harvested, fixed, and cryosectioned. The numbers of red cell colonies and green cell colonies were evaluated by confocal microscopy of lung sections. (A–C) Maximum intensity projection of representative confocal images of lung sections, showing red cell colonies (empty vector, yellow arrowheads) vs. green cell colonies (expressing zyxin and/or α5 integrin, white block arrows) for all groups of mice. Nuclei are stained blue using DAPI. (D) Cell colonies were counted for 15 representative sections 4 mm2 in area. Cells expressing zyxin or α5 integrin accumulated more in the lung parenchyma compared with empty vector control cells. In addition, cells expressing both zyxin and α5 integrin were the most adherent group of cells, with high affinity for lung parenchyma. Graph shows the mean with error bars for SEM. Bars identify the data sets compared in unpaired Student's t tests; *p < 0.05, **p < 0.01, ***p < 0.001.

References

    1. Ambati SR, Lopes EC, Kosugi K, Mony U, Zehir A, Shah SK, Taldone T, Moreira AL, Meyers PA, Chiosis G, et al. Pre-clinical efficacy of PU-H71, a novel HSP90 inhibitor, alone and in combination with bortezomib in Ewing sarcoma. Mol Oncol. 2014;8:323–336. - PMC - PubMed
    1. Ambros IM, Ambros PF, Strehl S, Kovar H, Gadner H, Salzer-Kuntschik M. MIC2 is a specific marker for Ewing's sarcoma and peripheral primitive neuroectodermal tumors. Evidence for a common histogenesis of Ewing's sarcoma and peripheral primitive neuroectodermal tumors from MIC2 expression and specific chromosome aberration. Cancer. 1991;67:1886–1893. - PubMed
    1. Amsellem V, Kryszke MH, Hervy M, Subra F, Athman R, Leh H, Brachet-Ducos C, Auclair C. The actin cytoskeleton-associated protein zyxin acts as a tumor suppressor in Ewing tumor cells. Exp Cell Res. 2005;304:443–456. - PubMed
    1. Arjonen A, Kaukonen R, Ivaska J. Filopodia and adhesion in cancer cell motility. Cell Adh Migr. 2011;5:421–430. - PMC - PubMed
    1. Arndt CA, Crist WM. Common musculoskeletal tumors of childhood and adolescence. N Engl J Med. 1999;341:342–352. - PubMed

Publication types

MeSH terms