. 2014 Jul 23;34(30):9891-904.
doi: 10.1523/JNEUROSCI.0876-14.2014.

Mutant β-III spectrin causes mGluR1α mislocalization and functional deficits in a mouse model of spinocerebellar ataxia type 5

Affiliations

Mutant β-III spectrin causes mGluR1α mislocalization and functional deficits in a mouse model of spinocerebellar ataxia type 5

Karen R Armbrust et al. J Neurosci. .

Abstract

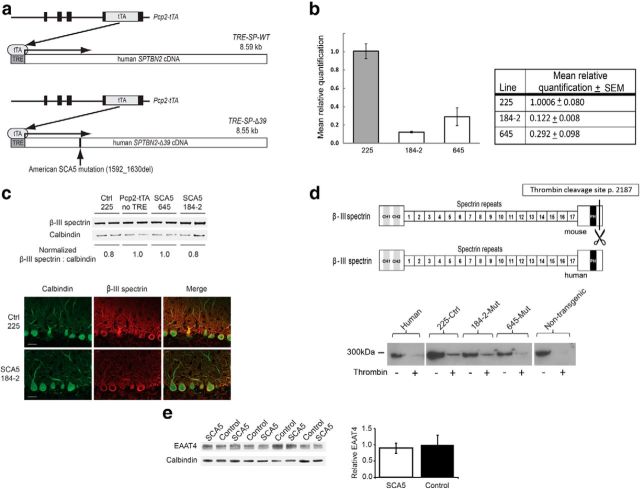
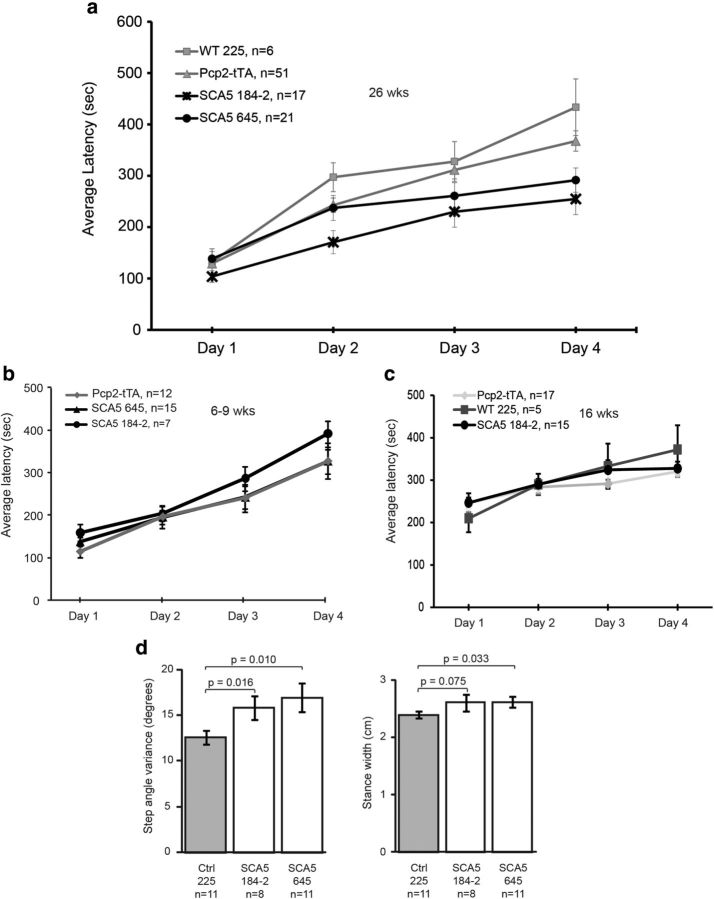
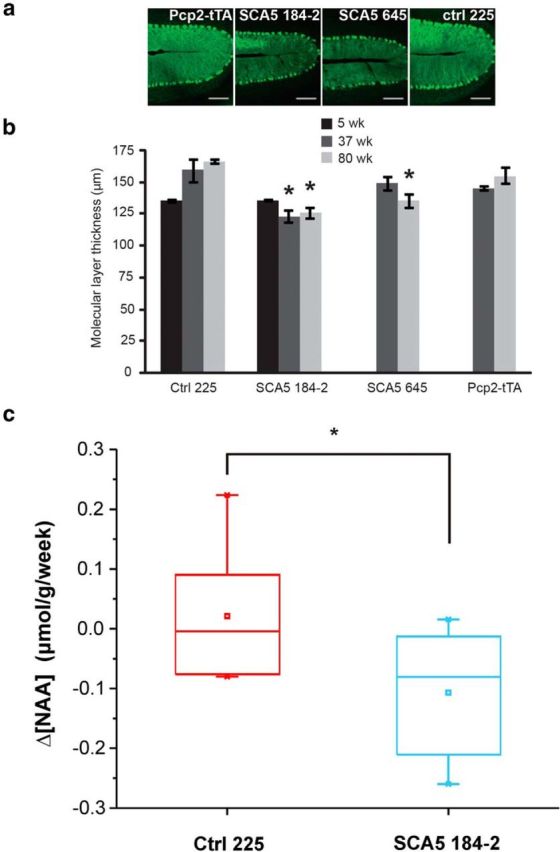
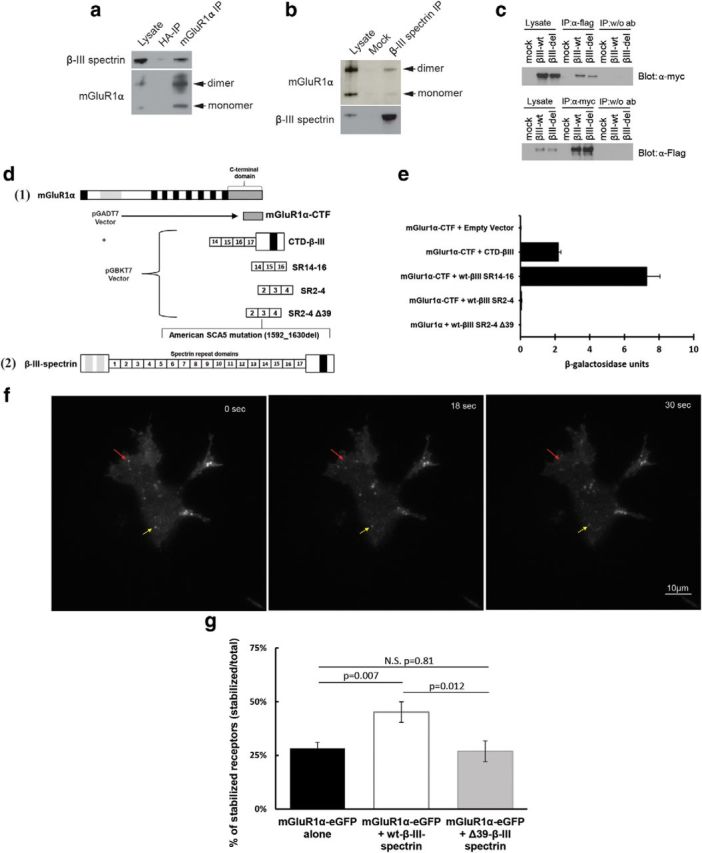
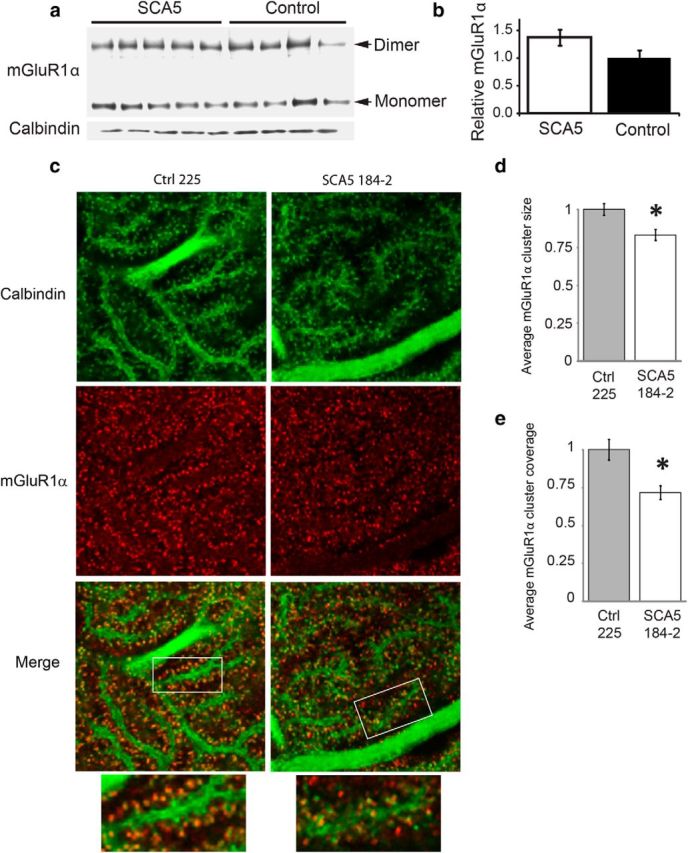
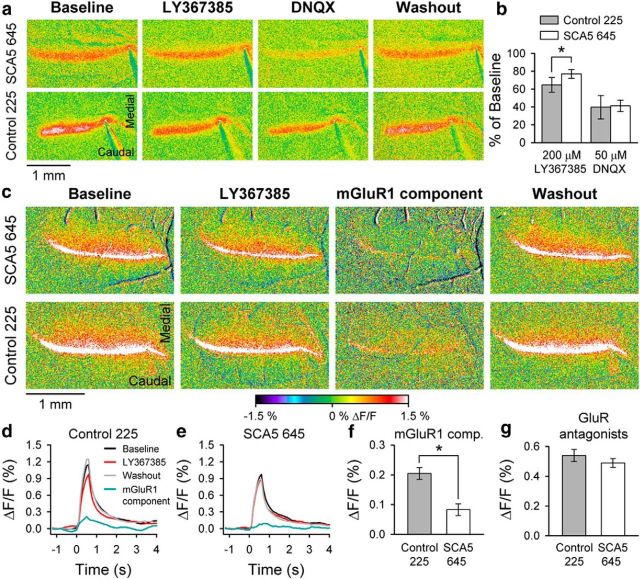
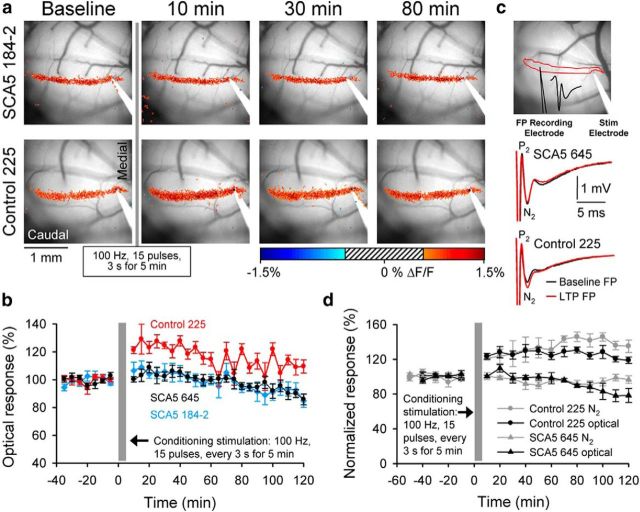
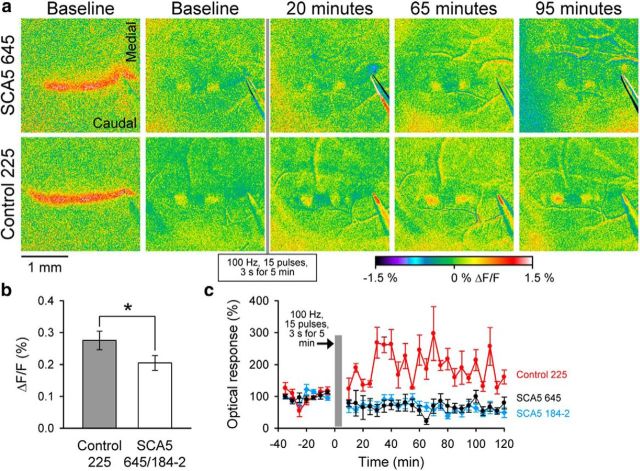
Spinocerebellar ataxia type 5 (SCA5), a dominant neurodegenerative disease characterized by profound Purkinje cell loss, is caused by mutations in SPTBN2, a gene that encodes β-III spectrin. SCA5 is the first neurodegenerative disorder reported to be caused by mutations in a cytoskeletal spectrin gene. We have developed a mouse model to understand the mechanistic basis for this disease and show that expression of mutant but not wild-type β-III spectrin causes progressive motor deficits and cerebellar degeneration. We show that endogenous β-III spectrin interacts with the metabotropic glutamate receptor 1α (mGluR1α) and that mice expressing mutant β-III spectrin have cerebellar dysfunction with altered mGluR1α localization at Purkinje cell dendritic spines, decreased mGluR1-mediated responses, and deficient mGluR1-mediated long-term potentiation. These results indicate that mutant β-III spectrin causes mislocalization and dysfunction of mGluR1α at dendritic spines and connects SCA5 with other disorders involving glutamatergic dysfunction and synaptic plasticity abnormalities.

Keywords: Purkinje cells; long term potentiation; mGluR1α; mouse model; neurodegeneration; spinocerebellar ataxia type 5.


Figures

Figure 1.
Figure 1.
Transgene design and expression. a, Schematic diagram showing transgenes used to express SCA5 mutant or wild-type human SPTBN2 transgenes. Pcp2-tTA+/−/TRE-SP-WT+/− control mice express wild-type human β-III spectrin in cerebellar Purkinje cells. Pcp2-tTA+/−/TRE-SPΔ39+/− SCA5 mice express human β-III spectrin with the American SCA5 deletion in cerebellar Purkinje cells. b, Mean relative cerebellar transgenic RNA levels in 3-week-old mice, n = 3 for all lines. c, Top, Immunoblot analyses of cerebellar lysates to compare β-III spectrin protein levels between non-TRE Pcp2-tTA controls with control wild-type SCA5 (line 225), and mutant SCA5 lines (645 and 184–2) at 3 weeks of age. Calbindin was used as the loading control. Bottom, Immunofluorescence staining of cerebellar sections with α-calbindin and α-β-III spectrin antibodies in control 225 and SCA5 184–2 mice. Scale bars, 10 μm. d, Top, Schematic diagram showing strategy to cleave mouse but not human β-III spectrin protein with thrombin. Bottom, Protein blot showing uncleaved recombinant human protein is expressed in 225 control and SCA5 184–2, and 645 lines. Thrombin protease (Novagen) recognizes a peptide sequence present only in the endogenous mouse β-III spectrin and is predicted to cleave at peptide 2187, removing the C-terminal antibody sc-28273 recognition site (p. 2311–2380). e, Top, EAAT4 immunoblot of cerebellar lysates from SCA5 line 184–2 and control line 225 mice at 9–11 months of age with densitometric quantitation showing no significant difference in the EAAT4:calbindin ratio between genotypes (t test; p = 0.78). Cerebellar immunofluorescence of calbindin and EAAT4 in control line 225 and SCA5 line 184–2 mice. Scale bars: 100 μm. Data are expressed as mean ± SEM.
Figure 2.
Figure 2.
Expression of mutant β-III spectrin in Purkinje cells reduces motor coordination. a, Average latency on the accelerating rotarod was assessed in age-matched mice at 26 weeks of age. b, c, Average latency on the accelerating rotarod was assessed at 6–9 weeks (b) and 16 weeks (c). Values shown are averages of all four trials for each day. d, DigiGait analyses of step angle variance and stance width in SCA5 mice and age-matched controls between 12 and 16 months of age. Error bars represent SEM. ANOVA followed by post hoc analysis (Student's t test) was performed to compare groups; *p < 0.05 compared with Pcp2-tTA+/− mice.
Figure 3.
Figure 3.
Expression of mutant β-III spectrin in Purkinje cells causes progressive cerebellar degeneration. a, Representative images showing calbindin antibody staining of the primary cerebellar fissure at 80 weeks of age. Scale bars, 100 μm. b, Progressive thinning of the molecular layer is seen in mutant but not control lines. Mice from the 184–2 mutant line show progressive thinning of the molecular layer compared with controls at 37 (control 225, n = 4; SCA5 184–2, n = 4; p = 0.02) and 80 (control 225, n = 3; SCA5 184–2, n = 3; p = 0.008) but not 5 weeks, and mice from the 645 mutant line show significant thinning at 80 (control 225, n = 3; SCA5 645, n = 4; p = 0.009) but not 37 weeks of age. Control line 225 is not significantly different from Pcp2-tTA+/− mice at 37 weeks or 80 weeks. Graph shows mean values ± SEM; *p < 0.05 compared with age-matched control 225 mice. c, Box plot showing change of NAA concentration per week in the cerebella of SCA5 mice (n = 8) and controls (n = 7), each scanned twice at various time points from 37–59 weeks of age. The weekly change in NAA concentration was significantly different (*p = 0.04) in SCA5 mice (−0.11 μmol/g) compared with controls (0.02 μmol/g).
Figure 4.
Figure 4.
β-III spectrin interacts with mGluR1α. a, IP of cerebellar lysates from nontransgenic mice with anti-mGluR1α (mGluR1α IP) or control anti-hemagglutinin antibody (HA-IP). b, Cerebellar lysates from nontransgenic mice immunoprecipitated with the anti-β-III spectrin (β-III spectrin IP) or no antibody (Mock). c, Lysates from HEK293T-cells transfected with empty vector, myc-tagged wild-type β-III spectrin, and FLAG-tagged mGluR1α, or myc-tagged mutant β-III spectrin and FLAG-tagged mGluR1α were immunoprecipitated with the anti-myc antibody. d, Schematic diagram of clones used for Y2H analyses of mGluR1α/ β-III spectrin interaction. Schematic diagrams for the full-length mGluR1 (1) and B-III spectrin (2) are shown at the top and bottom of d, respectively. The C-terminal domain of mGlur1α (mGluR1α-CTF) containing the last 133 aa was used for all Y2H experiments. The β-III spectrin clones are as follows: CTD-β-III, spectrin contains spectrin repeat 14 through end of protein; SR14–16, spectrin repeats 14–16; SR2–4, spectrin repeats 2–4; SR2–4Δ39, spectrin repeats 2–4 containing the American mutation (1592_1630del). e, Resulting β-galactosidase levels detected by the CPRG assay. f, Illustration of TIRF analysis in transfected HEK293T cells. Red arrow shows a receptor present at the beginning of time-lapse images. In this example, the receptor leaves the membrane before 30 s and is scored as an unstable receptor. The yellow arrow shows a receptor persisting at the membrane for the entire 60 s, which is scored as a stabilized receptor using Fiji ImageJ (NIH) software. g, Quantification of percentage of stabilized receptors persisting at the plasma membrane during 60 s image acquisition, N = 180–205 eGFP molecules per group. Data are expressed as mean + SEM, with analysis performed as described (see Materials and Methods, Statistical analyses).
Figure 5.
Figure 5.
Loss of mGluR1α clustering in SCA5 mice. a, mGluR1α immunoblot analysis of cerebellar lysates from SCA5 line 184–2 (n = 5) and control line 225 (n = 4) mice at 9–11 months of age. b, Densitometric analysis shows no significant difference in the mGluR1α:calbindin ratio between genotypes (t test; p = 0.11). Data are expressed as mean ± SEM. c, Immunofluorescence staining of calbindin and mGluR1α at dendritic spines in 8- to 10-month-old SCA5 and control mice. Calbindin stains Purkinje dendrites and spines. Representative control and SCA5 images are shown. The control image shows that mGluR1α clusters at the dendritic spines, with a more diffuse mGluR1α staining pattern in the SCA5 image. Scale bars, 5 μm. d, We performed mGluR1α cluster analysis as previously described by Das and Bank (2006) and further detailed in the Materials and Methods section in SCA5 line 184–2 and control line 225 mice, n = 5 per genotype. The average size of mGluR1α clusters was significantly reduced in SCA5 mice compared with controls (t test; *p < 0.02). e, The average mGluR1α cluster coverage, defined as the percentage of the image area covered by clusters (Das and Banker, 2006), was significantly reduced in SCA5 mice compared with controls (t test; *p < 0.02). Data are normalized to control and expressed as mean values ± SEM.
Figure 6.
Figure 6.
Reduced activity of mGluR1 receptors in SCA5 mutant mice. a, Example flavoprotein images of the beam-like responses to parallel fiber stimulation in SCA5 645 and control line 225 before, during, and after adding the mGluR1 antagonist LY367385 (200 μm) and AMPA receptor antagonist DNQX (50 μm) to the bathing Ringer's solution. b, Amplitude of the flavoprotein response to parallel fiber stimulation relative to baseline in control and mutant mice (645) during application of LY367385 and DNQX. c, Example Ca2+ images of the beam-like response to parallel fiber stimulation in SCA5 line 645 and control line 225 before, during, and after adding mGluR1 antagonist LY367385 (200 μm) to the bathing Ringer's solution. The mGluR1 component images (third column) are the subtraction of the LY367385 image from the baseline image. d, e, Time courses of the responses shown in c. f, Peak amplitude of the mGluR1 component for the control (n = 4) and mutant SCA5 mice (n = 4). g, Peak amplitude of the Ca2+response during the application of LY367385 (200 μm), DNQX (100 μm), and APV (200 μm).
Figure 7.
Figure 7.
Loss of mGluR1-mediated LTP in SCA5 mice. a, Example experiments in an SCA5 line 184–2 mouse and a control line 225 mouse of the responses to parallel fiber test stimulation before (baseline) and after (10, 30, and 80 min) high-frequency, burst parallel fiber conditioning. The flavoprotein responses were thresholded and displayed on an image of the folium. The striped region in the center of the pseudocolored scale bar represents the pixels falling within the mean ± 2.5 SD statistical threshold and these pixels are not displayed. Scale bar, 1 mm. b, Average optical responses relative to baseline (mean ± SEM) before and after the conditioning stimulation for control line 225 (n = 8), SCA5 line 645 (n = 8), and SCA5 line 184–2 (n = 4). c, Image showing the field potential recording procedure with the microelectrode position in the center of the flavoprotein optical response evoked by the stimulation electrode and includes an example of the presynaptic (P1/N1) and postsynaptic (N2) response evoked by parallel fiber stimulation. Example field potentials shown at an increased gain illustrate the baseline postsynaptic component (N2) during the baseline (black) and 50 min (red) after the conditioning for both the control and mutant mice. d, Plots of the optical (black symbols) and N2 amplitudes (gray symbols) for control (circle; n = 4) and SCA5 mutant mice (triangle; n = 4).
Figure 8.
Figure 8.
Reduced amplitude and LTP of long-latency patches in SCA5 mice. a, Example of the beam and long-latency patch responses before LTP induction in SCA5 line 645 and a control line 225 mice. The long-latency patches are shown for baseline and at 20, 65, and 95 min following LTP conditioning paradigm. b, Amplitude of the long-latency patches during the baseline for SCA5 lines 645 (n = 4) and 184–2 (n = 4) combined and control mice (n = 4). c, Averaged amplitude of the long-latency patches in relation to baseline before and after the conditioning stimulation for the control line 225 (n = 4), SCA5 line 645 (n = 4), and SCA5 line 184–2 (n = 4).

References

    1. Aiba A, Kano M, Chen C, Stanton ME, Fox GD, Herrup K, Zwingman TA, Tonegawa S. Deficient cerebellar long-term depression and impaired motor learning in mGluR1 mutant mice. Cell. 1994;79:377–388. doi: 10.1016/0092-8674(94)90205-4. - DOI - PubMed
    1. Barnes JA. University of Minnesota; 2011. A functional examination of the afferent cerebellar cortical circuitry of ATXN1 mice in vivo. PhD thesis.
    1. Batchelor AM, Garthwaite J. Novel synaptic potentials in cerebellar Purkinje cells: probable mediation by metabotropic glutamate receptors. Neuropharmacology. 1993;32:11–20. doi: 10.1016/0028-3908(93)90124-L. - DOI - PubMed
    1. Baude A, Nusser Z, Roberts JD, Mulvihill E, Mcllhinney RA, Somogyi P. The metabotropic glutamate receptor (mGluRl[alpha]) is concentrated at perisynaptic membrane of neuronal subpopulations as detected by immunogold reaction. Neuron. 1993;11:771–787. doi: 10.1016/0896-6273(93)90086-7. - DOI - PubMed
    1. Benarroch EE. Metabotropic glutamate receptors: synaptic modulators and therapeutic targets for neurologic disease. Neurology. 2008;70:964–968. doi: 10.1212/01.wnl.0000306315.03021.2a. - DOI - PubMed

Publication types

Substances